
Three years is a short time, but perhaps enough to give a sense of what is happening to US metropolitan areas. For both reasons of less uncertainty (and less work for me), I look at just the 107 US metro areas with 500,000 or more people in 2013. These regions house 213 million, two-thirds of the population. I look at the populations of core cities and their suburbs, comparing amounts and rates of change, with further comparison by population size and by region. One definitional problem is what I mean by “core” central city: not the multi-names given by OMB, but rather the historic cities by which we know the places. These can sometimes be a pair, for example, Minneapolis-St. Paul, Dallas-Ft. Worth, San Francisco-Oakland and San Bernardino-Riverside. Another problem I do not try to deal with is whether there were annexations to the core cities in these 3 years.
City and Suburb: the Nation
The 107 core cities grew to almost 60 million, but still only 28 percent of the metropolitan population, the suburbs to 153 million. The central cities grew by almost 2 million, a 3.4% gain, while suburbs added 4.4 million, for a slower rate of 3.0%, giving value to the claim of urban revitalization in recent years. We can first deconstruct this change by size of metro areas, large (those over 2.25 million), medium (those from 1 to 2.5 million), and “small” (those under 1 million).
The interesting story here is that is that the smaller metros, often thought of as the faster growing, e.g., in the 1990s, were the slowest for 2010-2013 at only 2.5%, for both cities and suburbs. Next were the giant metropolises over 2.5 million, growing at an intermediate rate of 3.2%, again with no difference between cities and suburbs. So the particular successful cities now are the medium-sized metros, here from 1 to 2.5 million, whose cities grew by an impressive 4.3% in 3 years, but with a lower 2.3% growth in their suburbs. These intermediate metro areas also had a much smaller suburban share overall of 58% compared to 74% for the largest areas and 69% for the smaller.
Differences Across Broad Regions, the North, the South and the West
Confirming expectations, and continuing trends of several decades, the North’s metro areas had the highest total population, but the smallest change for both cities and suburbs, but the region also shows the biggest gap between very low suburban (1.3 %) and a not quite so low city rate of 1.8%. The south, continuing a pattern of larger absolute and relative growth, with city growth moderately faster (5.3%) than in their suburbs (4.6%). In the west, too, cities grew just slightly more than the suburbs.
| City and Suburb: Population Change 2010-2013 (Thousands) | ||||||||
| Size | Large Metros (>2.5 mil) | Medium Metros (1-2.5 Mil) | Small Metros (Under 1 Mil) | Total | ||||
| City 2010 | 31,004 | 15,557 | 11,143 | 57,704 | ||||
| City 2013 | 32,016 | 16,261 | 11,426 | 59,703 | ||||
| Suburb 2010 | 87,958 | 34,959 | 25,738 | 148,655 | ||||
| Suburb2013 | 90,753 | 35,907 | 26,368 | 153,028 | ||||
| % in suburb | 74 | 69 | 70 | 72 | ||||
| Large Metros (>2.5 mil) | Medium Metros (1-2.5 Mil) | Small Metros (Under 1 Mil) | Total | |||||
| Total Change | % change | Total Change | % change | Total Change | % change | Total Change | % change | |
| Metro Change | 3,807.0 | 3.2 | 1,624 | 2.7 | 914 | 2.5 | 6,345 | 3.1 |
| City Change | 1,008.0 | 3.2 | 675 | 4.3 | 283 | 2.5 | 1,966 | 3.4 |
| Suburb Change | 2,799.0 | 3.2 | 949 | 2.3 | 631 | 2.5 | 4,379 | 3 |
| % change in suburbs | 74 | 58 | 69 | 69 | ||||
| Region | North | South | West | Total | ||||
| City 2010 | 23,448 | 17,882 | 16,358 | 57,688 | ||||
| City 2013 | 23,920 | 18,866 | 16,958 | 59,744 | ||||
| Suburb 2010 | 62,910 | 48,179 | 37,565 | 148,654 | ||||
| Suburb2013 | 63,732 | 50,380 | 38,921 | 153,033 | ||||
| % in suburb | 73 | 73 | 70 | |||||
| North | South | West | Total | |||||
| Total Change | % change | Total Change | % change | Total Change | % change | Total Change | ||
| Metro Change | 1,241 | 1.4 | 3,144 | 4.7 | 1,956 | 3.6 | 6,341 | |
| City Change | 422 | 1.8 | 944 | 5.3 | 600 | 3.7 | 1,966 | |
| Suburb Change | 892 | 1.3 | 2,201 | 4.6 | 1,356 | 3.6 | 4,449 | |
| % change in suburbs | 72 | 70 | 69 | |||||
Example City and Suburb Change
Here we examine the full list of places, to find which contribute to the growth of cities and of suburbs. I will note metro areas where the highest absolute and relative growth was in cities (1), or in suburbs (2), and those metro areas, where both city and suburban growth were high. But I will also note metro areas with very low growth and then those which are right in the middle, the average place! Please see the following table. The reader can also see the geographic patterns of these differences in absolute and relative growth via two maps, the first showing city growth and the second on suburban growth.
| Fast, Slow, and Medium Growth of Cities and Suburbs | ||||||
| Fast City Growth | Fast Suburb Growth | Fast City and Suburb Growth | ||||
| Rate | Rate | City Rate | Suburb Rate | |||
| Washington | 7.4 | Houston | 7.8 | Dallas | 6 | 6 |
| Atlanta | 6.6 | Boise | 6.1 | San Antonio | 6.2 | 6.5 |
| Seattle | 7.2 | Des Moines | 7.1 | Austin | 12 | 7.7 |
| Charlotte | 8.4 | Provo | 7.1 | Orlando | 7.2 | 6.1 |
| New Orleans | 13 | Raleigh | 6.9 | 7.7 | ||
| Omaha | 6.2 | Charleston | 6.7 | 7.3 | ||
| Durham | 7.6 | Ft Myers-CapeCoral | 7.5 | 6.6 | ||
| Denver | 8.2 | |||||
| Medium City Growth | Medium Suburbs | |||||
| All 3.3 to 3.5% | All 2.8 to 3.2 | |||||
| Riverside-SanBernardino | Minneapolis | |||||
| Las Vegas | Tampa-St Petersburg | |||||
| Provo | Baltimore | |||||
| Chattanooga | Sacramento | |||||
| Honolulu | Richmond | |||||
| Columbia SC | Tucson | |||||
| Tulsa | ||||||
| Fresno | ||||||
| BatonRouge | ||||||
| Stockton | ||||||
| Madison | ||||||
| Slow Growth City | Slow Growth Suburb | Slow Growth City & Suburb | ||||
| Rate | Rate | City Rate | Suburb Rate | |||
| Cincinnati | 0.2 | Albany | 0.7 | Chicago | 0.9 | 0.8 |
| Baltimore | 0.2 | Dayton | 0.2 | Detroit | -3.5 | 0.7 |
| Milwaukee | 0.7 | Wichita | 0.9 | St Louis | -0.3 | 0.6 |
| Birmingham | -0.1 | New Orleans | 0.8 | Pittsburgh | -0.1 | 0.2 |
| Worcester | 0.8 | Cleveland | -1.7 | -0.3 | ||
| Baton Rouge | 0 | Providence | -0.1 | 0.2 | ||
| Youngstown | -1.4 | Hartford | 0.2 | 0.2 | ||
| Lancaster | -1.5 | Buffalo | -1 | 0.1 | ||
| Portland, ME | 0.8 | Rochester | -0.1 | 0.4 | ||
| New Haven | 0.7 | -0.1 | ||||
| Allentown | 0.5 | 0.8 | ||||
| Akron | -0.5 | 0.7 | ||||
| Syracuse | -0.3 | 0 | ||||
| Toledo | -1.7 | 0.9 | ||||
| Harrisburg | -1.4 | 1.8 | ||||
| Largest Absolute Growth | ||||||
| Cities | Rate | Absolute Growth | Suburbs | Rate | Absolute Growth | |
| New York | 2.8 | 231,000 | New York | 13 | 153,000 | |
| Dallas | 6 | 116,000 | Los Angeles | 2.3 | 211,000 | |
| LosAngeles | 2.4 | 92,000 | Dallas | 6 | 208,000 | |
| Houston | 4.1 | 95,000 | Houston | 7.8 | 257,000 | |
| San Antonio | 6.2 | 82,000 | Washington | 5.3 | 266,000 | |
| Austin | 12 | 95,000 | Miami | 4.5 | 238,000 | |
| Raleigh | 6.9 | 84,000 | Atlanta | 4.3 | 205,000 | |
| Boston | 2.1 | 104,000 | ||||
| SanFrancisco | 4 | 133,000 | ||||
| Phoenix | 5 | 138,000 | ||||
| Riverside | 3.7 | 138,000 | ||||
| Seatttle | 4.8 | 127,000 | ||||
| Denver | 5.9 | 105,000 | ||||
| Orlando | 6.1 | 116,000 | ||||
City Growth
Although New York and Los Angeles had high absolute growth, the rates of growth were modest. In contrast, several southern and western cities showed both high numbers and rates of change—notably Austin, Dallas, San Antonio, three just in Texas, and Raleigh, NC. And there were high rates in more southern and western metro areas: Washington, Atlanta, Charlotte, Durham, but especially New Orleans (recovery), and Seattle and Denver, and the northern outlier, Omaha.
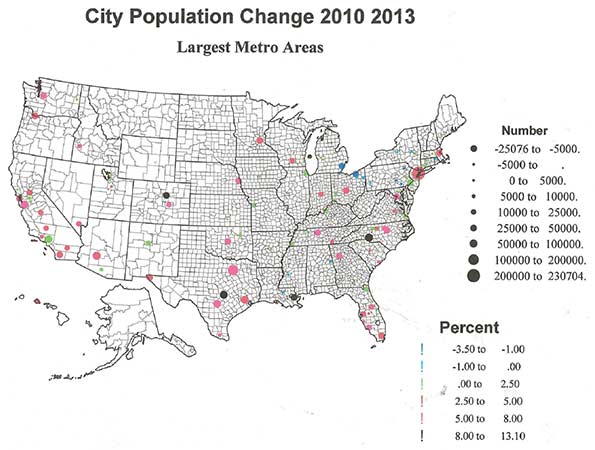
Most slow-growing or losing cities are in the north – 21 cities – with only Birmingham and Baton Rouge in the south, pretty much a continuation of historic deindustrialization trends. Fourteen have slow growing suburbs as well.
Suburb Growth
Suburban growth is absolutely much larger than city growth, so is more prominent on the map. Fourteen suburban areas added at least 100,000 in three years, led by Washington (266,000), Houston (257,000), and Miami (238,000). But the highest rates of change were for Houston, Des Moines, Boise and Provo, metros where suburban growth was rather faster than central city. Other growing regions include Dallas, San Antonio, Austin, Orlando, Charleston, Raleigh and Ft. Myers-Cape Coral – note all are in the south – for which both city and suburban rates of growth were high.
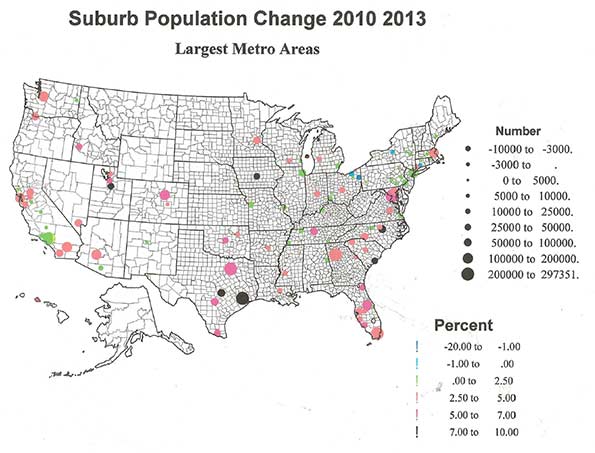
Slow growing suburbs but not the core cities characterized Atlanta, Dayton, Wichita, and New Orleans, but in 15 other metro areas, all in the north, both suburban and core city growth was slow. Moderately fast (5 to 6%) city growth occurred for San Jose, Nashville, Oklahoma City, McAllen, TX, and El Paso. Moderately fast growing suburban regions include Miami, Phoenix, Denver, Nashville, Jacksonville, Oklahoma City, Salt Lake, and McAllen.
City and Suburb: Richer and Poorer
The economic context for cities and suburbs has changed. In the 1970s and 1980s core cities suffered as suburban employment expanded mightily, spurred by the new interstate highways, and also fueled by social change, especially school desegregation, leading to massive white flight. Thus cities became poorer as the more affluent joined the suburban lifestyle. Some cities partly recovered by the late 1980s into the 1990s due to growth of the finance sectors, but suburbanization was still dominant even from 2000 to 2010. But around 1990 some cities – mostly high level regional capitals – began to gentrify, as younger, more affluent, professional and educated, and often unmarried singles or partners, reclaimed desirable older city housing. Some are even reverse commuting to suburban jobs, such as to Microsoft from Seattle.
Such gentrification led to substantial displacement of the poor and of especially of minorities from the cities to adjacent suburbs, again typified by Seattle experience. The process has gone so far that some central cities are no higher in income and lower in poverty than their suburbs, as in Seattle, San Francisco, and Portland. The most gentrified cities, as measured by the share of neighborhoods upgraded, are Boston, Seattle, New York, San Francisco, Atlanta, Chicago, Portland, Tampa, Los Angeles and Denver—many of the biggest metro areas, and also cities with substantial growth 2010-2013.
The relative vibrancy and high income of these cities is obviously related as well to the growing inequality of income and wealth of the last 20 years. This has particularly hurt the middle classes, but enabled the educated and professional non-family population to reinvigorate the core cities, even if they have to endure very high housing costs. If the economy improves in terms of jobs and middle class income, I would predict more successful growth in the suburbs than the media and even real estate market folks think, as people find more and more affordable housing available.
Conclusion
The period of review is short, but does show continuing growth of both core cities and their suburbs, but with the growth edge going to cities, unlike the dominant pattern of earlier decade. The “new urbanist” interpretation might be that people have come to support denser urban living, but an equally plausible interpretation is that the recession is not yet over, and that the market and financing for suburban single family home living is still suppressed. And a further realistic view is that the huge increase in inequality, reducing the number and buying power of the middle classes, is the more likely explanation of the relative success of cities, as adult children return to family homes, elderly move in with children, or people just double up in homes or are forced to accept living in apartments, even if they might prefer homes.
Richard Morrill is Professor Emeritus of Geography and Environmental Studies, University of Washington. His research interests include: political geography (voting behavior, redistricting, local governance), population/demography/settlement/migration, urban geography and planning, urban transportation (i.e., old fashioned generalist).


Boston Metro area
Boston Metro is difficult because the core urban area is almost a dozen municipalities - and several of the "suburbs" are more like small cities instead of truly "suburban" communities. You might want to look at that data again using MAPC's regional designations.