
Working at home, much of it telecommuting, has replaced transit as the principal commuting alternative to the automobile in the United States outside New York. In the balance of the nation, there are more than 1.25 commuters who work at home for each commuter using transit to travel to work, according to data in the American Community Survey for 2013 (one year). When the other six largest transit metropolitan areas are included (Los Angeles, Chicago, Philadelphia, Washington, Boston and San Francisco), twice as many people commute by working at home than by transit.
Overall, working at home leads transit in 37 of the 52 major metropolitan areas (over 1 million population in 2013).
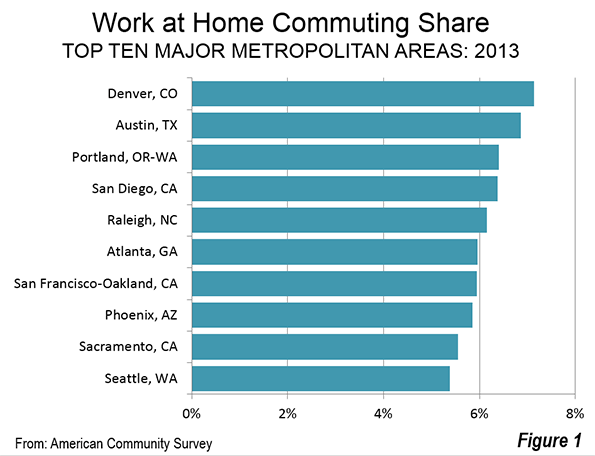
The Top Ten
Not surprisingly, most of the strongest work at home markets are technology hubs. However, the strength of working at home, and particularly its growth in these metropolitan areas may seem at odds with the huge expenditures on urban rail. Nine of the top 10 working at home metropolitan areas have built or expanded rail systems, yet working at home has grown far faster than transit. The exception is Seattle, where transit has grown faster, but nearly all the increase has been on buses and ferries. Only two of the top ten metropolitan areas have larger transit shares than work at home shares.
Here are the top 10 working at home major metropolitan areas (Figure). Market shares are shown to the second digit to eliminate ties.
- Denver has the highest working at home commute share, at 7.14%. Like nine of the other top 10 major metropolitan areas, Denver has an urban rail system. Even so, Denver's transit work trip market share is a full third lower, at 4.41%. In 2000, working at home had only a lead over transit (4.58% v. 4.45%).
- Technology hub Austin places a close second, at 6.87%. Austin's working at home commute share is nearly 3 times its 2.37% transit share. Working at home increased from 3.60% in 2000, while transit dropped from 2.51%, despite the addition of a rail line.
- Portland, also a technology hub, and a decorated model among urban planners, ranks third in working at home commute share, at 6.40%. Transit share slightly smaller, at 6.37%. In 1980, however, transit's market share was nearly a third again its present level (8.4%), before the first of its six rail lines opened. In contrast, working at home has nearly tripled its share from 2.2% in 1980. In 2000, working at home attracted 4.60% of commuters in Portland, well below the 6.27% transit share.
- San Diego ranks fourth in working at home, with a 6.38% market share. The California city built the first of the modern light rail lines in the early 1980s. San Diego's transit market share is approximately one half its working at home share (3.17 percent). In 2000, working at home had a commute share of 4.40%, while transit's share was 3.31%.
- Raleigh, another technology hub, ranks fifth in working at home with a 6.16% market share. Raleigh is the only metropolitan area among the top 10 that does not have an urban rail system. Raleigh's transit work trip market share is 1.03%. In 2000, working at home had a commute share of 3.46%, while transit's share was 0.86%, modestly below the 2013 figure.
- Atlanta ranks sixth in working at home, with a 5.96% market share. Atlanta has built more miles of high quality Metro (grade separated subway and elevated rail) than anywhere outside Washington and San Francisco in the last half century. Even so, Atlanta has experienced a more than 50% decline in its transit market share and now that share is barely half that of working alone (3.08%). In 2000, working at home had a commute share of 3.47%, while transit's share was 3.46%.
- San Francisco, another technology hub, ranks seventh in working at home, with a 5.94% market share. San Francisco is unique in having a substantially higher transit than work at home market share (16.13%). San Francisco is the second strongest transit market in the United States, trailing only New York (30.86%). In 2000, working at home had a commute share of 4.27%, while transit's share was 13.77%.
- Phoenix nearly equals San Francisco, with a 5.85% working at home market share. This is more than double the 2.61% transit market share. In 2000, working at home had a commute share of 3.66%, while transit's share was 1.93%.
- Sacramento ranks 9th in working at home market share, at 5.56%, more than double its 2.65% transit work trip share. In 2000, working at home had a commute share of 4.03%, while transit's share was 2.67%.
- Seattle, also a technology hub, has a working at home market share of 5.38%, for a ranking of 10th. Like San Francisco has a higher transit work trip market share (9.31%). In 2000, working at home had a commute share of 4.17%, while transit's share was 6.97%.
The work at home and transit market shares are indicted for each major metropolitan area in the table.
Where Working at Home is the Weakest
In most of the strongest transit metropolitan areas, as opposed to cities that have systems that simply are not so widely used, working at home doesn’t usually achieve second place to cars. As noted above, San Francisco has a considerably stronger transit share than virtually any major metropolitan area outside New York.
New York, by far the largest transit market in the United States, is also the largest work at home market in raw numbers (386,000). Yet, New York's transit market share (30.86%) is seven times its work at home share (4.17%).
Chicago, Washington and Boston have transit market shares approximately three times that of working at home, while Philadelphia's transit share is 2.5 times as high.
This is not to say that working at home is in decline. Strong working at home gains --- nearly 50% to over 100% from 2000 to 2013 --- were made in each of these six metropolitan areas. Yet, with its smaller base, working at home is not likely to exceed transit in the near future.
Los Angeles is a possible exception. Since 2013, working at home has closed approximately 60% of the gap with transit. Continuation of present trends would have working at home becoming the most popular alternative to cars in Los Angeles before 2020.
The Future?
Working at home has grown despite having received little attention in urban planning, compared to that of expensive rail projects. Its success has eliminated millions of daily work trips, reduced greenhouse gases and responded to the desire for better lifestyles by many. With continuing improvements in technology, and higher acceptance among companies and government agencies, working at home seems likely to continue its growth in the coming decades.
| Work at Home to Transit Commuting Ratio | |||
| Major Metropolitan Areas: 2013 | |||
| Metropolitan Area | Work at Home Work Trip Share | Transit Work Trip Share | Work at Home Commuters per Transit Commuter |
| Atlanta, GA | 5.96% | 3.08% | 1.93 |
| Austin, TX | 6.87% | 2.37% | 2.89 |
| Baltimore, MD | 4.10% | 6.79% | 0.60 |
| Birmingham, AL | 2.79% | 0.78% | 3.57 |
| Boston, MA-NH | 4.46% | 12.76% | 0.35 |
| Buffalo, NY | 2.62% | 2.92% | 0.90 |
| Charlotte, NC-SC | 5.19% | 1.74% | 2.98 |
| Chicago, IL-IN-WI | 4.32% | 11.75% | 0.37 |
| Cincinnati, OH-KY-IN | 3.85% | 2.17% | 1.78 |
| Cleveland, OH | 3.80% | 3.25% | 1.17 |
| Columbus, OH | 4.14% | 1.69% | 2.44 |
| Dallas-Fort Worth, TX | 4.98% | 1.39% | 3.58 |
| Denver, CO | 7.14% | 4.41% | 1.62 |
| Detroit, MI | 3.52% | 1.68% | 2.09 |
| Grand Rapids, MI | 4.22% | 1.62% | 2.61 |
| Hartford, CT | 3.50% | 3.07% | 1.14 |
| Houston, TX | 3.69% | 2.37% | 1.56 |
| Indianapolis. IN | 3.93% | 1.12% | 3.51 |
| Jacksonville, FL | 4.99% | 1.07% | 4.66 |
| Kansas City, MO-KS | 4.08% | 1.22% | 3.35 |
| Las Vegas, NV | 3.18% | 3.47% | 0.92 |
| Los Angeles, CA | 5.13% | 5.84% | 0.88 |
| Louisville, KY-IN | 2.77% | 1.71% | 1.63 |
| Memphis, TN-MS-AR | 2.37% | 1.15% | 2.07 |
| Miami, FL | 4.76% | 4.07% | 1.17 |
| Milwaukee,WI | 3.52% | 3.65% | 0.96 |
| Minneapolis-St. Paul, MN-WI | 4.88% | 4.64% | 1.05 |
| Nashville, TN | 4.50% | 1.02% | 4.43 |
| New Orleans. LA | 2.67% | 2.70% | 0.99 |
| New York, NY-NJ-PA | 4.17% | 30.86% | 0.13 |
| Oklahoma City, OK | 3.07% | 0.54% | 5.74 |
| Orlando, FL | 5.05% | 1.73% | 2.92 |
| Philadelphia, PA-NJ-DE-MD | 3.99% | 10.00% | 0.40 |
| Phoenix, AZ | 5.85% | 2.61% | 2.25 |
| Pittsburgh, PA | 3.71% | 4.89% | 0.76 |
| Portland, OR-WA | 6.40% | 6.37% | 1.01 |
| Providence, RI-MA | 3.23% | 2.68% | 1.21 |
| Raleigh, NC | 6.16% | 1.03% | 5.96 |
| Richmond, VA | 4.25% | 1.34% | 3.18 |
| Riverside-San Bernardino, CA | 5.00% | 1.46% | 3.42 |
| Rochester, NY | 3.39% | 2.53% | 1.34 |
| Sacramento, CA | 5.56% | 2.65% | 2.10 |
| Salt Lake City, UT | 5.13% | 3.25% | 1.58 |
| San Antonio, TX | 4.33% | 2.51% | 1.72 |
| San Diego, CA | 6.38% | 3.17% | 2.01 |
| San Francisco-Oakland, CA | 5.94% | 16.13% | 0.37 |
| San Jose, CA | 4.05% | 4.24% | 0.96 |
| Seattle, WA | 5.38% | 9.31% | 0.58 |
| St. Louis,, MO-IL | 4.09% | 2.91% | 1.40 |
| Tampa-St. Petersburg, FL | 5.11% | 1.38% | 3.70 |
| Virginia Beach-Norfolk, VA-NC | 3.38% | 1.71% | 1.98 |
| Washington, DC-VA-MD-WV | 5.02% | 14.16% | 0.35 |
| From: American Community Survey, 2013 (One Year) | |||
Wendell Cox is principal of Demographia, an international public policy and demographics firm. He is co-author of the "Demographia International Housing Affordability Survey" and author of "Demographia World Urban Areas" and "War on the Dream: How Anti-Sprawl Policy Threatens the Quality of Life." He was appointed to three terms on the Los Angeles County Transportation Commission, where he served with the leading city and county leadership as the only non-elected member. He served as a visiting professor at the Conservatoire National des Arts et Metiers, a national university in Paris. Wendell Cox is Chair, Housing Affordability and Municipal Policy for the Frontier Centre for Public Policy (Canada), is a Senior Fellow of the Center for Opportunity Urbanism and is a member of the Board of Advisors of the Center for Demographics and Policy at Chapman University.
Photo by By Rae Allen, "My portable home office on the back deck"


I like this as very
I like this as very informative.
Virtual Presence, Cisco TelePresence
In 1993, the City of Los Angeles published its Telecommuting Study which found that if Telecommuting where fully implemented, it would cut traffic and new high rise construction by 30%. The study had been ordered by Mayor Bradley, but by the time it was issued, Dick Riordan, billionaire and lover of super dense CRA construction, had come into office. From that date on, the 1993 Telecommuting Study was persona non grata at city hall. Instead, Los Angeles squandered billions of tax dollars on high rise projects and subways. The result was that L.A. was insolvent, its population was poorer, unemployment rate was much higher than average, and it had cease to be a Destination City. Only the State's abolition of the corrupt CRA on 2-1-2012 saved LA from bankruptcy.
While we are in the craze of tiny portable devices, we are blind to what's around the corner. Of course, we're blind since we walk around with our noses in our smartphones as we become dumber and dumber about what is really occurring in society.
Virtual Reality is based on a vastly upgrade Internet, which we do not construct because we divert our money on choo-choos trains and football stadiums as well as on half-empty high rises which people shun.
Back to Virtual Reality. Please forgive my mini-tirade. The world including Los Angeles, has the means for huge, larger than life size high definition screens with surround sound and surround mics. Virtual Presence makes sitting at the desk to type or to use Skype obsolete.
The newer cameras and direction mics can track you as you move about the room, or you can order the camera focus to stay stationary and/or mute your mic. It's your option. The point is that with Virtual Presence, you are Virtually Present wherever you want to be.
Compared to the vast international VP shopping with avatars, the current on-line shopping will be like using a manual typewriter. We have the technology to allow you to try on clothes and see how they fit. You can take down items and turn them around and inspect them closeup. We will not be limited to lists, but we will have virtual stores will aisles which we can stroll down.
With VP, you can go shopping with friends or relatives (which do not have to be mutually exclusive categories). For example, a mother, daughters can all shop on-line together at the same Paris Bridal Salon with their atvars in order to select a wedding dress etc., and they can all converse with each other even though the Mom is in Woodland Hills, and her daughters in Atlanta and Singapore. Then, they can all transfer in an instant to a Valley bake shop to select a cake. Try doing that on the subway!
When Virtual Presence does arrive in the next few years, a premium will be placed on larger homes. While Virtual Presence will not require us to stay inside or prevent us from physical travel, it will be so easy and so effective, that people will increasingly use VP. In order to avoid cabin fever, we will need larger homes with larger yards.
Also, attorneys, and CPA's and a host of other professionals will abandon down towns. When an attorney charges $650/hr why spend 2 hours a day commuting? What client will want to pay the 3 hours it takes his attorney to attend a 3 minute status conference at a distant courthouse for $1,950.00, when his attorney can do it everything connected with the status conference including check-in in 10 minutes?
Telcommuting and other uses of VP are not an all-or-nothing situation. Even if one travels to an office twice a week, that is a 3/5 reduction in freeway usage. Also, people can accomplish a lot from home. A law office clerk can sort the in-coming emails and file the documents and make certain each attorney receives his notice of what arrived for him. He may be in Costa Rica on the beach or he may be in his office in Rancho Cucamonga. That does not matter. The officer clerk can stay at home until his/her family has had breakfast and everyone is set for the day, before he/she physically travels to the office.
Just the re-distribution of traffic as Los Angeles did during the 1984 Olympics can do wonders to reduce freeway congestion.
The reduction in traffic congestion will be a huge reduction in urban air pollution (which will be less of a problem once we transfer to electric vehicles.)
Virtual Presence also brings parts of urban areas closer to together. we know that van Nuys is much closer to down town Los Angeles at 12 Noon than it is at 9:00 a.m. Distance is a function of time and time is a function of traffic density. When VP reduces the traffic density, it shortens the time for travel and hence shortens the distance between places. I do not think Einstein was referring to this type of relativity, but it is the type we can all understand.
As Joel Kotkin and Wendell Cox has shown for the US, 80% prefer R-1 homes. VP will make larger R-1 homes with larger yard farther from the urban core much more likely.
Wise planners should be concentrating on the suburbs and beyond and the last thing they should do is increase core urban density unless they want to create modern Cabrini-Greens, Joseph Darst and Pruit-Igoes.