
The world's two leading Global Cities, London and New York are, according to most indicators, remarkably similar in their patterns of regional commuting. This is the conclusion from our recent review of commuting in London and commuting in New York. This analysis contrasts the results between the London Area (Greater London Authority, East and Southeast regions) and the New York combined statistical area, which stretches from New York state, to New Jersey, Connecticut and Pennsylvania. (A unique animated graphic illustrates the London commuting pattern, at "undertheraeder.com." The map is here and illustrates the size of the greenbelt in the London area).
Population and Area
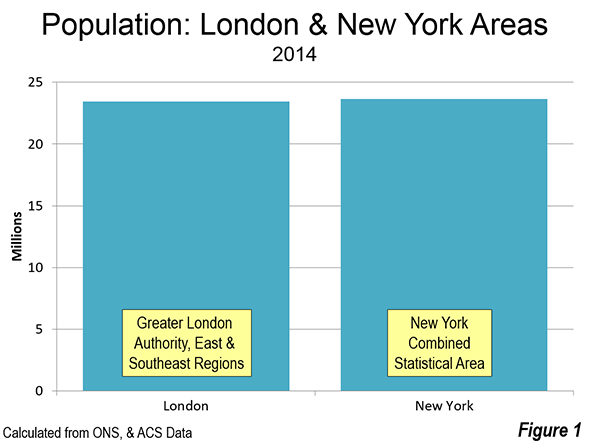
The London and New York areas had almost identical populations in 2014. New York had 23.663 million residents and London had 23.431 million residents, just one percent less. London, however, is growing more rapidly, adding 1.1 percent per year since the 2011 census, while New York's increase has been 0.8 percent annually since the 2010 census (Figure 1).
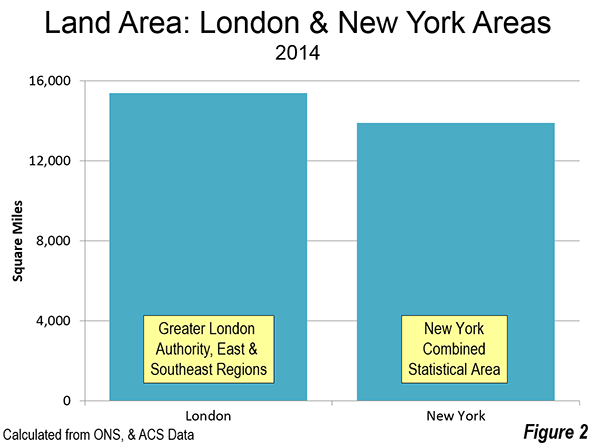
The land areas are also similar (Figure 2). The London commute shed covers 15,400 square miles (39,800 square kilometers). The New York area is about 10 percent smaller, covering 13,900 square miles (36,000 square kilometers).
Broadly, the two cities can be divided into similar sectors. Both have among the largest central business districts (downtowns or CBDs) in the world. The two central municipalities, the Greater London Authority and the city of New York both have somewhat over 8 million population. There is a first ring of counties located outside the Greater London Authority and the city of New York. Finally there are outer counties in both areas. The geographic areas are described in the "Geographical Note" below.
Distribution of Employment
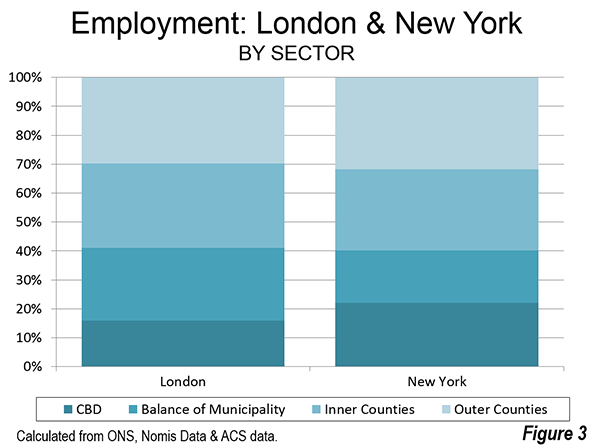
In the distribution of employment between the two cities is remarkably similar (Figure 3). In each case, the suburban counties account for 60% of employment. In both London and New York, the outer counties have slightly more employment than the inner counties, though in both cases the inner counties and outer counties have approximately 30% of employment.
This leaves approximately 40% of the employment for the central cities. In New York, 22% of the employment is in Manhattan, which contains the central business district. In London, a somewhat smaller 16% of the employment is in the five local authority areas that include the central business district (Camden, Lambeth, city of London, Southwark and the city of Westminster). The balance of the city of New York --- the outer boroughs of the Bronx, Brooklyn, Queens and Staten Island, has just 18% of the area's employment, while the balance of the Greater London Authority --- outer London and the balance of inner London --- has 25% of the area's employment.
Where People Live and Work
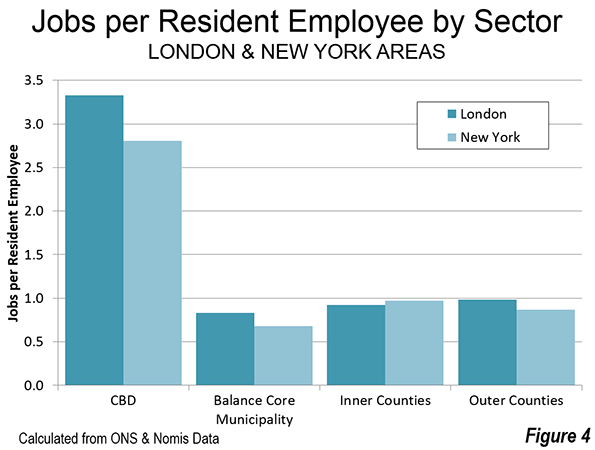
The distribution of the jobs are relative to resident workers is also similar between London and New York. In both cities, the inner counties and the outer counties have nearly the same number of jobs as resident workers. In the case of London, there are 99 jobs per 100 resident workers in the inner counties and a somewhat smaller 92 in the outer counties. In New York, there are 97 jobs per resident worker in the inner counties and 87 in the outer counties. The largest imbalances in both areas occur in the core municipalities. There are approximately 330 jobs per 100 resident workers in the local authority areas containing London's central business district. Manhattan, with New York's central business district has a somewhat smaller 280 jobs per 100 resident workers. Indicating the draw of the central business district for workers living in the balance of both core municipalities, there are only 83 jobs for each 100 workers in the balance of the Greater London Authority and 68 in the balance of the city of New York (Figure 4).
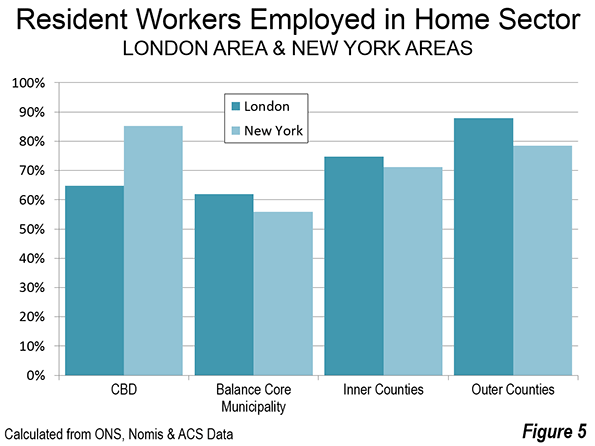
In the two cities, most resident workers are employed in their home sector, 68% in New York and 67% in London. This is also the case in each of the sectors of the two cities. In New York, the largest percentage of resident workers (85%) is employed in Manhattan, with the central business district. The number is considerably smaller (64%) in the jurisdictions containing London's central business district. In London, the largest share of resident workers employed in their own sector is 88% in the outer counties. In both cities, the inner counties also have a relatively strong balance of local residents, with 71% working in their home sector in New York and 75% in London. In both cities, the smallest number of resident workers employed in their home sectors are in the balance of the core municipality, 62% in London and 55% in New York (Figure 5).
Commuting to the Central Business Districts
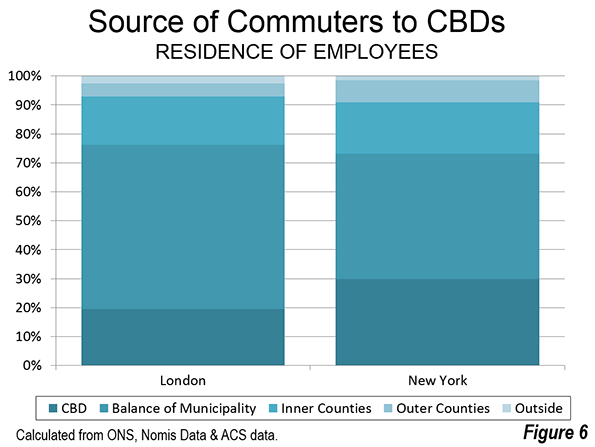
The data indicates a surprisingly limited draw for the two central business districts. Often media articles and even academics presume that cities are monocentric --- that most employees work in the central business district. This isn't even close to being the case. In fact, the analysis of commuting in the New York and London areas shows that only in the sectors containing the central business districts does the central business district attract most of the resident workers. Even in the relatively jobs-poor balance of the two core municipalities, only 36% in New York and 30% in London work in the jurisdictions containing the CBDs. In the inner counties, the numbers are much smaller. Only 14% of New York inner county resident workers have employment in Manhattan, with an even smaller number, 8% of London's inner county resident workers commuting to CBD jurisdictions. The numbers are even smaller in the outer counties, where only 4.6% of New Yorkers commute to Manhattan and 2.4% of Londoners commute to the CBD jurisdictions (Figure 6).
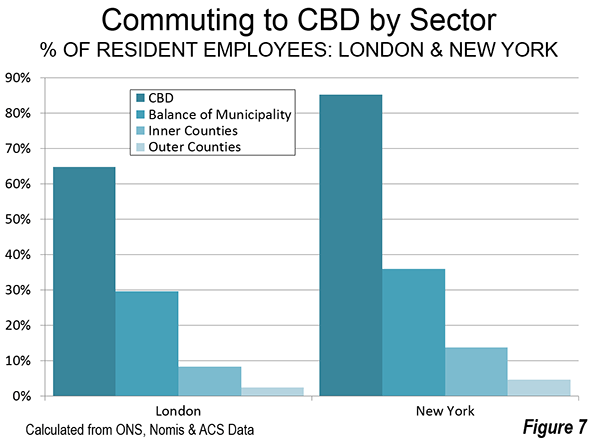
In both cases, approximately 75% of CBD employees are drawn from the core municipality. In New York, approximately 30% of the central business district employees are from Manhattan, while 43% are from the outer boroughs. In London, 19% of the central business district employees are from the five CBD jurisdictions and 57% are from the balance of the Greater London Authority.
Manhattan is a somewhat stronger draw to the suburban counties, with 18% of employees from the inner counties and 8% from the outer counties. The London CBD draws 17% of its workers from the inner counties and 5% from the outer counties. Despite the comprehensive suburban rail system in New York and both suburban and national rail system in London, comparatively few workers commute from beyond the outer counties --- 2.6% in London in 1.5% and New York (Figure 7).
How Commuters Travel
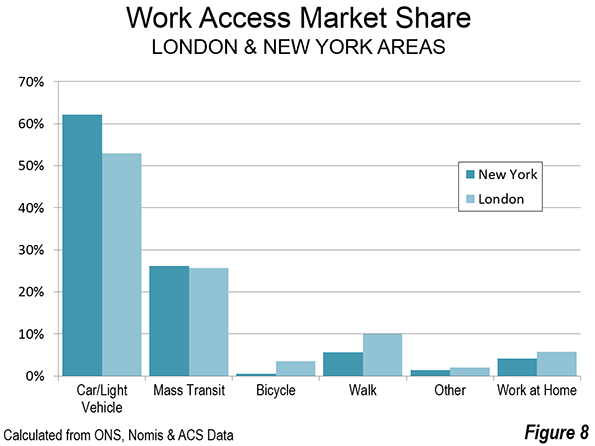
There are also similarities between the commuting methods in the London and New York areas. In both cases, cars, vans and other light vehicles carry the majority of commuters, 53% in London and 62% in New York (Figure 8). Mass transit carries virtually the same share of commuters in both cities, at 26%. Many more Londoners walk to work the New Yorkers, at 10%, compared to less than 6%. Approximately 5.8% of London workers report working at home, somewhat more than New York's 4.1% (Since the two nations use different census survey instruments, the data may not be completely comparable).
Widely Dispersed Global Cities
Ultimately the key finding is that the world's two greatest Global Cities are widely dispersed. Despite the strength of their cores, the overwhelming majority of employment is in the suburbs. Only a small percentage of resident employees in the suburban areas work in the central business districts. A majority of resident workers is attracted to the CBDs only from the jurisdictions containing the CBDs themselves.
-----
Geographical Note: The geographical sectors are as follows:
London (Greater London Authority, Southeast England and East England): The central business district is situated in a wide corridor on both sides of the Thames River. It is contained in local authority areas, including the city of London, the city of Westminster and the boroughs of Camden, Southwark and Lambeth. The inner counties border on the metropolitan greenbelt, which surrounds the Greater London Authority. They are Berkshire Buckinghamshire, Essex, Hertfordshire, Kent and Surrey. The outer counties are Cambridgeshire, East Sussex, Hampshire, Isle of Wight, Norfolk, Oxfordshire, Suffolk and West Sussex.
New York (New York Combined Statistical Area): The area includes 35 counties, in eight metropolitan areas, including New York (NY-NJ-PA), Allentown-Bethlehem (PA-NJ), Bridgeport-Stamford (CT), East Stroudsburg (PA), Kingston (NY), New Haven (CT), Torrington (CT) and Trenton (NJ).
-----
Wendell Cox is Chair, Housing Affordability and Municipal Policy for the Frontier Centre for Public Policy (Canada), is a Senior Fellow of the Center for Opportunity Urbanism (US), a member of the Board of Advisors of the Center for Demographics and Policy at Chapman University (California) and principal of Demographia, an international public policy and demographics firm.
He is co-author of the "Demographia International Housing Affordability Survey" and author of "Demographia World Urban Areas" and "War on the Dream: How Anti-Sprawl Policy Threatens the Quality of Life." He was appointed to three terms on the Los Angeles County Transportation Commission, where he served with the leading city and county leadership as the only non-elected member. He served as a visiting professor at theConservatoire National des Arts et Metiers,a national university in Paris.
Photograph: Traffic in Bergen County, New Jersey (a New York inner suburban county), by author.


