Data on population growth from 2010 to 2015 show a continuing concentration of people in metropolitan areas, especially in the large areas with over a million people, where presumably traditional values are most challenged. I show an amazing table, in which I have disaggregated population change by type of settlement, from the million-metro areas to the purely rural counties, comparing growth amounts and rates, plus noting how these areas actually voted in 2012. From the title, the news that growth is greatest in the biggest places seems bad for Republican prospects, but the accompanying maps also show that the greatest growth may well be in more Republican parts of metropolitan America – a story of geography vs. demographics.
The data from the table are dramatic. Note that 275 million, or 86%, live in census-defined metropolitan areas (with urban agglomerations over 50,000), and 55.5% in just the 58 metro areas of over 1,000,000. The biggest metro areas (but not the super large New York, Los Angeles, and Chicago) grew by 9.4 million, or 5.5%, the smaller metro areas by 3.4 million, or at 3.3 %, while non-metropolitan America dropped from 46.3 million to 46.1 million, down to 14% of the total population.
The final column of the table shows how these areas voted in the 2012 presidential election. Obama won the big metro areas of over one million by taking 57.6 percent of the 2 person vote, which enabled him to get almost 52% of the total US vote while winning the three megacities – New York, Los Angeles and Chicago – by an even wider margin. This meant that despite LOSING all other settlement categories – 48% in smaller metro areas, only 41% in micropolitan areas, and a pathetic 40 percent in rural small town America, the President still won handily.
| Population Change by Settlement Type, 2010 2015 | |||||||
| # Counties | 2010 Pop | 2015 Pop | Change | % Chg | % of Pop 2015 | % Obama, 2012 | |
| Million Metro Center Counties | 255 | 156,143 | 164,749 | 8,606 | 5.5% | 51.3% | |
| Million Metro Outlying Counties | 179 | 13,661 | 14,416 | 749 | 5.5% | 4.5% | |
| Total Million Metros | 434 | 169,804 | 179,165 | 9,355 | 5.5% | 55.7% | 57.6 |
| Other Metro Center Counties | 473 | 85,634 | 89,005 | 3,371 | 3.9% | 27.7% | |
| Other Metro Outlying Counties | 259 | 7,025 | 7,086 | 61 | 0.9% | 2.2% | |
| Total Other Metros | 732 | 92,659 | 96,091 | 3,432 | 3.7% | 29.9% | 48.3 |
| Micro Center Counties | 559 | 26,422 | 26,533 | 111 | 0.4% | 8.3% | |
| Micro outly | 92 | 1,080 | 1,070 | (10) | -0.9% | 0.3% | |
| Total Micropolitan Areas | 651 | 27,502 | 27,603 | 101 | 0.4% | 8.6% | 41.4 |
| Rural Sm Town | 727 | 14,058 | 13,899 | (159) | -1.1% | 4.3% | |
| Rural Sm Town | 598 | 4,731 | 4,663 | (68) | -1.4% | 1.5% | |
| Total Non-metro Counties | 1,325 | 18,789 | 18,462 | (327) | -1.7% | 5.7% | 40 |
| ALL | 3,142 | 308,774 | 321,435 | 12,664 | 4.1% | 100.0% | 52 |
So the good news for the Democrats is that the greatest population growth occurred in larger cities where Obama did best in and fell in areas he did poorest in.
But the story gets complicated once you get beyond the metro level. I now show maps, first of the pattern of population change by type of settlement, and then show how well Obama did in 2012 by these same settlement types. First we have a general map of population change for all US counties, in which I can display both the absolute change by symbol size and the percent change by color. Most apparent are the dominance of growth in metropolitan areas, especially in suburbs, and notably in the South and West. Note that quite a few of the growing counties appear to be in areas where Obama was not that strong (in maps to follow).
Population Change by Settlement Type
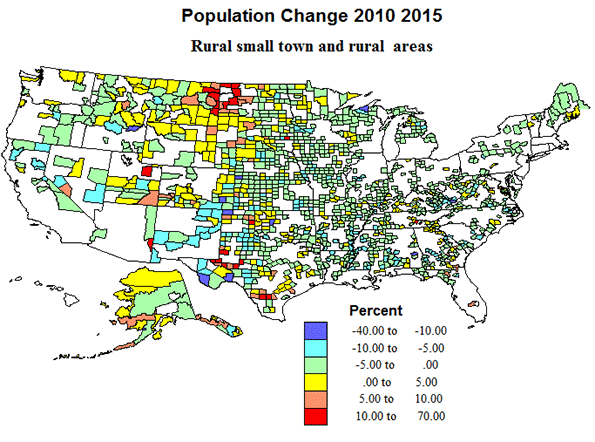
Rural and rural-small town areas include about 40% of counties and of the territory, but now hold under 6 percent of the population. Modest population loss is most common, especially across the eastern half of the country, while the pattern of change is more complex in the western half, with pockets of gain in areas of energy development, as in ND-MT, and TX-OK, undoubtedly temporary, and scattered areas of growth in environmental amenity areas farther west. The greatest extent of rurality is still from west Texas, north through Oklahoma, Kansas, Nebraska, South and North Dakota and Montana.
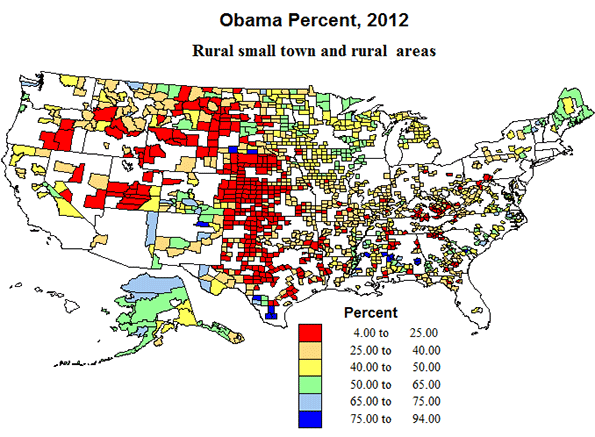
Politically, Republican Romney swept most rural, small town territory over sizeable contiguous areas in the high plains, as well as the Mormon realm, but Democrats did win in majority Black counties in the south, Latino counties in Texas, and in Native American Indian counties in the far west. In sum, not a story to comfort Republican hopes.
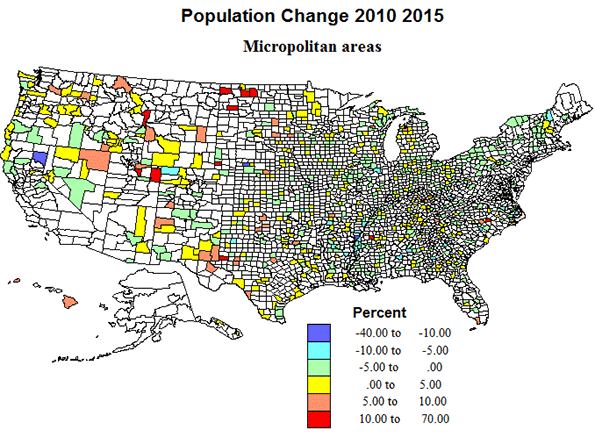
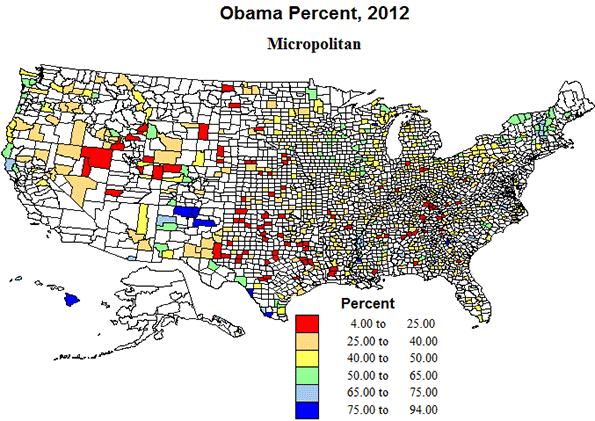
Micropolitan areas now include about 20 percent of counties and of territory, and house almost nine percent of the population. They experienced only modest population growth from, 2010 to 2015. They are quite widely dispersed across the country, with the exception of most of California. Just as with rural small-town territory, a pattern of modest loss prevails over the eastern half of the country and a more mixed pattern in the west, echoing the higher growth in areas of energy development, and in parts of the Mountain states and far west, including some environmentally attractive areas.
Politically, the micropolitan areas, with urban agglomerations between 10 and 50 thousand were almost as supportive of Republican Romney as the more rural areas, and in essentially the same geographic areas, in southern Appalachia, the high plains from Texas to North Dakota and in the Mormon realm, and with the same Democratic outliers in majority minority areas. Again, a pattern not too comforting for Republican prospects.
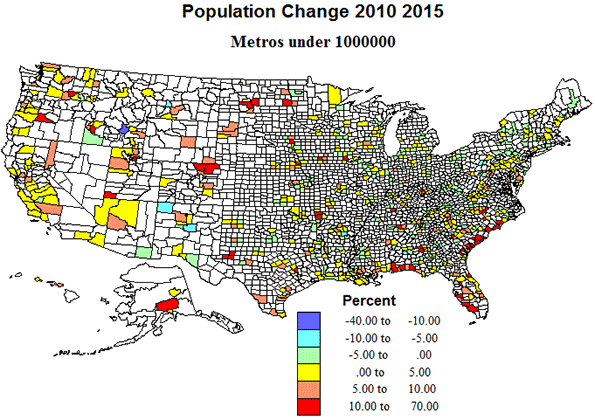
Metropolitan areas under 1 million represent what could be called middle, compromise America, with about one-fourth of US counties, and with 30% of the population. Their geographic pattern is one of broad distribution in the interior of the country, but with a marked coastal concentration in the Gulf and South Atlantic. Similarly, growth was modest or losses occurred in most of the interior eastern US, but big gains in southeastern coastal areas, and across most of the far west.
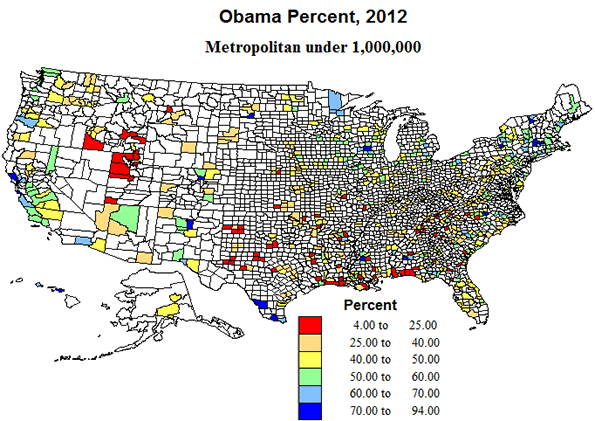
Politically, too, these areas are intermediate, with Obama receiving 48% of the vote in 2012. The outlying smaller metropolitan counties are indeed often quite rural. Some of the growing areas were tilted more Republican, as on the Gulf coast and especially in the Mormon west, but in the Atlantic coastal states, and Pacific coast states, Obama did much better.
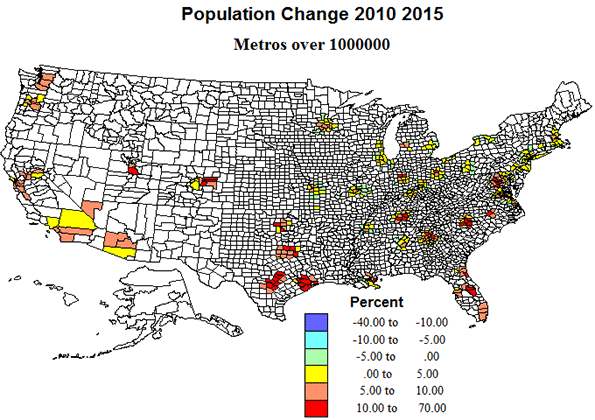
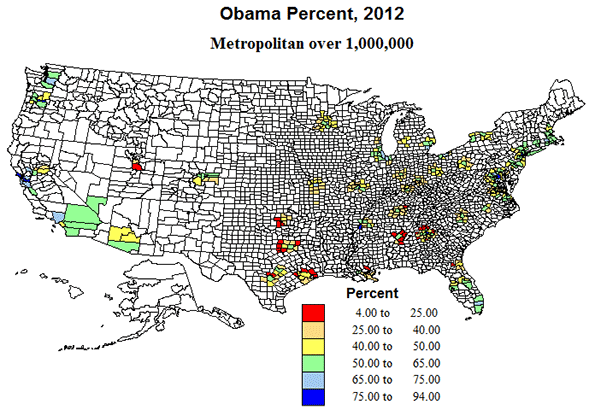
Metro areas over 1 million. Okay, these are the behemoths, one-seventh of counties with over half the population, and three-quarters of the growth. But the fastest growth was across the south and in the west, with moderate growth and even modest losses in the north. The biggest metros – NY, Chicago and LA -- grew well below national averages. Also, contrary to the perception of the death of suburbia, the outlying counties of this set experienced very high growth.
Politically, these suburban areas around the big metros may prove decisive, with the voting eligibility and inclinations of a diverse population critical to outcomes of the presidency and of Congress. Those suburban counties in the South appear to vote Republican, while those in the north and west became modestly Democratic. Size may benefit Democrats, but growth tilts Republican. Ultimately whichever proves most decisive may determine the election.
Richard Morrill is Professor Emeritus of Geography and Environmental Studies, University of Washington. His research interests include: political geography (voting behavior, redistricting, local governance), population/demography/settlement/migration, urban geography and planning, urban transportation (i.e., old fashioned generalist).


