
In 2015, the American Public Transportation Association issued a press release whose headline claimed that transit ridership in 2014 achieved a new record. However, the story revealed that 2014 ridership was the highest since 1956. That’s no more a record than if it was the highest since 2013.
The truth is that America’s urban population more than doubled between 1956 and 2014. Using the ridership number that really counts–trips per urban resident–2014’s number was a near-record low of 41 trips per person. The only time it was lower before 2014 was a few years in the mid-1990s, when ridership dropped to as low as 38 trips per person. The rate may fall to nearly that level in 2016.
When Congress passed the Urban Mass Transportation Act of 1964, Americans took an average of 62 transit trips per person. At that time, 82 percent of all transit systems were privately owned. Within a decade, nearly every major transit system and all but a handful of minor ones were “municipalized” and the subsidies began to flow. At first, the federal government provided only capital subsidies, but in 1974 it also provided operating subsidies.
By 1978, half of operating costs and, of course, all of the capital costs were subsidized. By the late 1980s, fares covered only a little more than a third of operating costs. With most money coming from taxpayers, transit agencies were more beholden to politicians than transit riders, and they became more interested in spending money to please political interests than in boosting transit ridership.
Since 1965, transit operating subsidies (adjusted for inflation to today’s dollars) total close to $800 billion. We don’t have accurate capital cost data from before 1992, but since then we’ve spent close to $400 billion on capital programs (which in the transit industry include maintenance), most of it on rail transit.
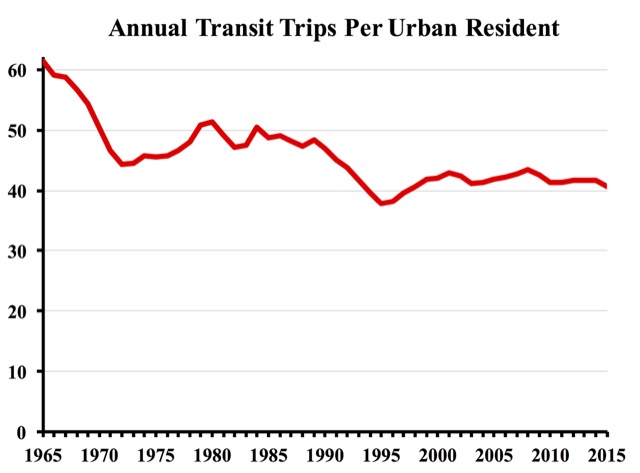
Thus, well over a trillion dollars in subsidies has resulted in transit ridership falling from 61 trips per urban resident in 1965 to 41 trips in 2015, and even less in 2016. The chart above shows that trips per urbanite have fluctuated since 1970, but those fluctuations are mainly in response to gasoline prices while the general trend is downward. To a large degree, this downward trend is because the subsidies have made transit agencies more responsive to politics than transit riders.
Advocates of industrial policy argue that government should pick growth industries and nurture them along to help maintain American preeminence in new technologies. Skeptics suggest that government is more likely to pick losers than winners. Transit is clearly one of those losers.
Most statistics in this post are from the American Public Transportation Association’s 2016 Public Transportation Fact Book data spreadsheet. Data for 2015 is from the National Transit Database. Urban population data are from the Census Bureau.
This piece first appeared on The Antiplanner.
Randal O’Toole is a senior fellow with the Cato Institute specializing in land use and transportation policy. He has written several books demonstrating the futility of government planning. Prior to working for Cato, he taught environmental economics at Yale, UC Berkeley, and Utah State University.
Photo:


