
The pattern of suburban (and exurban) population growth in the suburbs and exurbs that has dominated the United States since World War II has returned and is intensifying. This is evident from the latest American Community Survey (ACS) data for the 53 major metropolitan areas (more than 1 million population) as analyzed by the City Sector Model (See Note: The City Sector Model).
Before World War II, US metropolitan areas were considerably less automobile oriented and had higher population densities. There had been considerable suburbanization in the 1920s, facilitated at first by transit and then by early automobile growth, but that was largely interrupted by the Great Depression of the 1930s. More rapid suburbanization took place following the war.
The result was that the United States became an overly suburban nation (as research by Professor David L. A. Gordon and colleagues have also found in Canada and Australia).
The Rising Share of Suburban and Exurban Population
City Sector Model analysis shows that by 2000, 83.5 percent of major metropolitan area residents lived in the automobile oriented, principally postwar suburbs and exurbs. The exurbs largely include both urban development and rural areas within the metropolitan area (which is both the labor market and housing market).
The share of residents living in the suburbs and exurbs increased to 85.3 percent in 2010. The share of growth in the Urban Core was so small between 2000 and 2010 that the exurbs passed the urban core in population. The exurban population now leads that of the Urban Cores by 3,000,000.
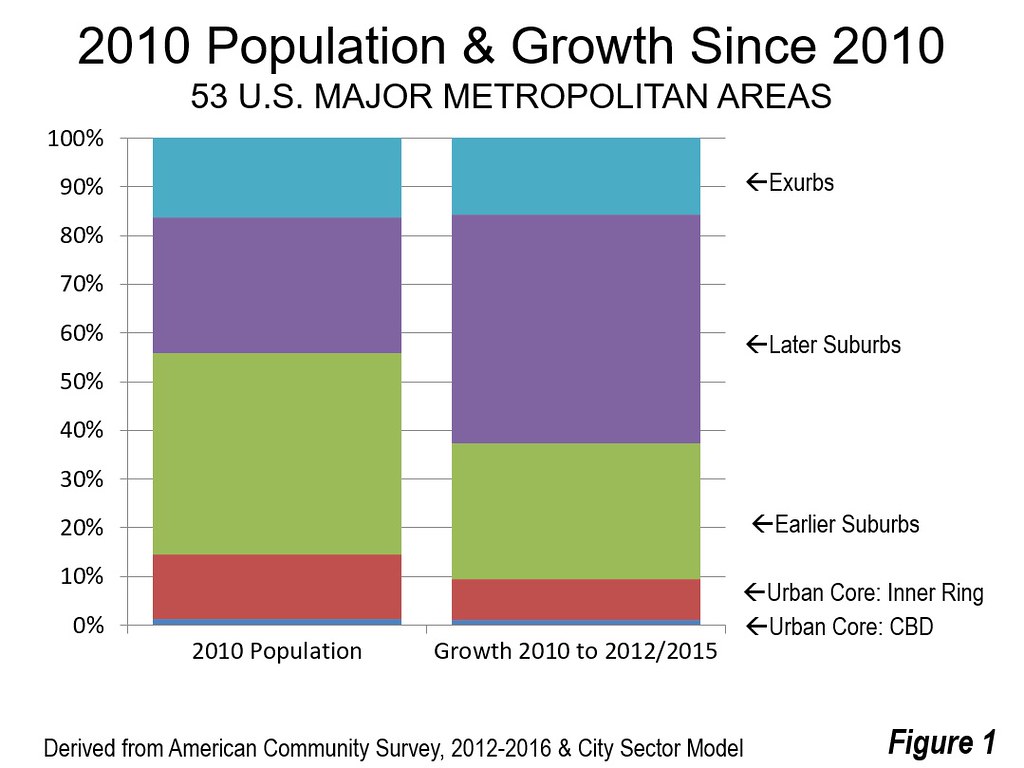
The most recent data, from the ACS 2012 to 2016 rolling survey (middle year: 2014) places the suburban and exurban share of major metropolitan area population at 85.5 percent. Since 2010, suburban and exurban growth has accounted for an even higher 90.5 percent of population growth (Figure 1). The share of growth in the Urban Core was 9.5 percent, well below its 14.5 percent share of the 2010 population. Even the prewar Central Business Districts, part of the urban core had growth that fell nearly one-third short of their 1.3 percent 2000 population (1.0 percent).
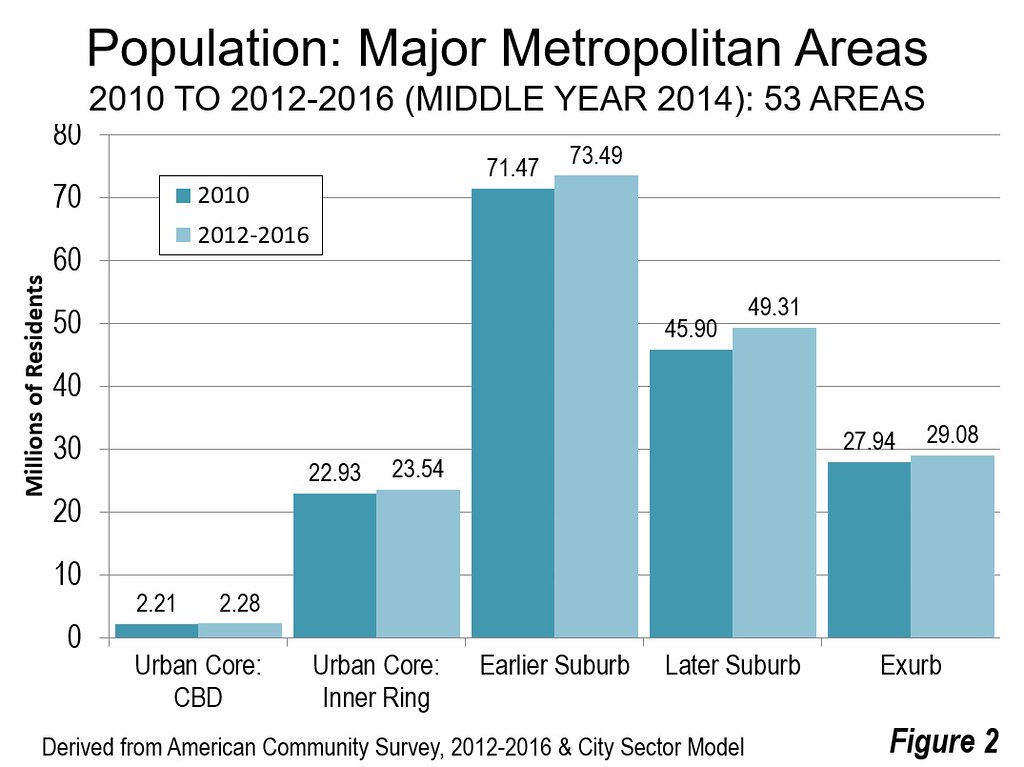
The overall growth in the suburbs and exurbs was 6.6 million from 2010. The Later Suburbs accounted for 3.4 million new residents, the Earlier Suburbs 2.0 million and the Exurbs 1.1 million. The Urban Core added 0.7 million, approximately 70,000 in the Central Business Districts and 610,000 in the Inner Ring (Figure 2). Overall suburban and exurban growth was nearly 10 times Urban Core growth.
Overall, the major metropolitan areas grew at a greater rate than the nation (0.50 percent annually), adding an average of 0.67 percent annually to their population since 2010. By far the greatest growth was in the Later Suburbs, where an annual average of 1.15 percent has been added to the population, more than double than the overall major metropolitan rate. The Exurbs grew nearly as fast as the metropolitan rate, while the Central Business District grew less than the major metropolitan area rate, but more than the national rate. The Inner Ring and Earlier Suburbs grew more slowly than both the national and major metropolitan area rates (Figure 3).
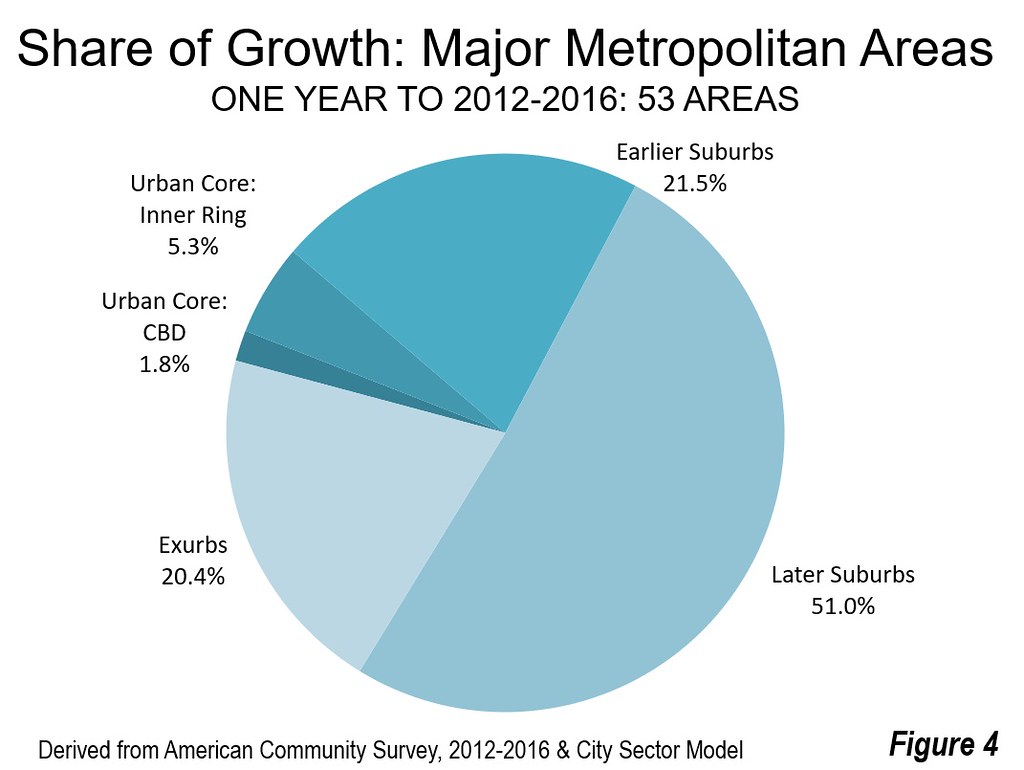
Over the last year, the suburbs and exurbs grew even more quickly, comprising 92.9 percent of major metropolitan growth, leaving just 7.1 percent of the growth for the Urban Core (Figure 4).

The suburbs and exurbs grew from 2010 in 51 of the 53 metropolitan areas. The only losses were in Cleveland and Pittsburgh, where Urban Core losses were even greater than the suburban and exurban losses. However, despite their declining share of the population growth, the Urban Cores have also continued to do better in population growth than in the three decades preceding 2000, before significant declines in central city crime rates. In 25 of the 53 major metropolitan areas, the Urban Cores have grown since 2010.
Some Urban Cores are Doing Very Well
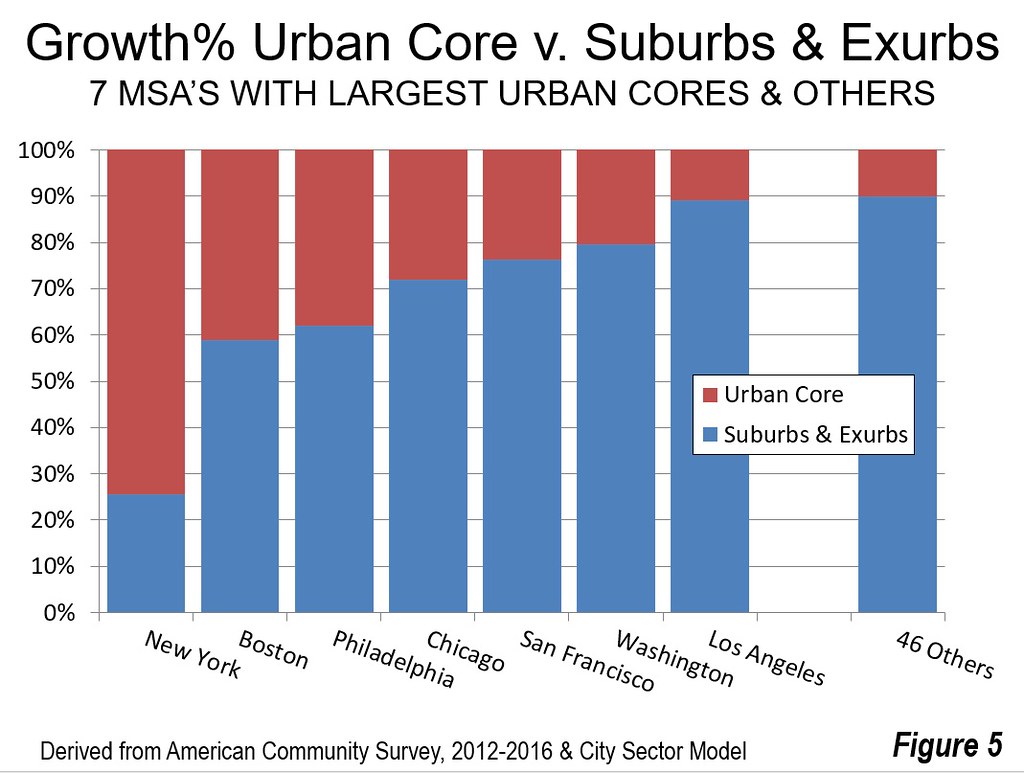
The good news for America's Urban Cores can be found in New York. New York is unique in having by far the largest Urban Core in the nation with 10.7 million residents and 53 percent of the metropolitan area population. Since 2010, New York has had 74 percent of its growth in the Urban Core and only 26 percent in the suburbs. This is by far the strongest urban core showing among the 53 major metropolitan areas and dwarfs that of the other six that have urban cores with more than 1 million population.
Each of the other six metropolitan areas with more than 1,000,000 urban core population had majority suburban growth, ranging from 59 percent in Boston to 80 percent in Washington. Five of these metropolitan areas, New York, Chicago, Philadelphia, San Francisco, Boston and Washington are also unique in having "transit legacy cities" at their cores, which contain 57 percent of transit commuting destinations, according to the 2016 American Community Survey (1 year data). The other metropolitan area with an Urban Core above 1,000,000 population, Los Angeles, has had 89.0 percent of its population growth in the suburbs and exurbs since 2010, about the same as the 90.5 percent average for all 53 metropolitan areas (Figure 5).
The Future?
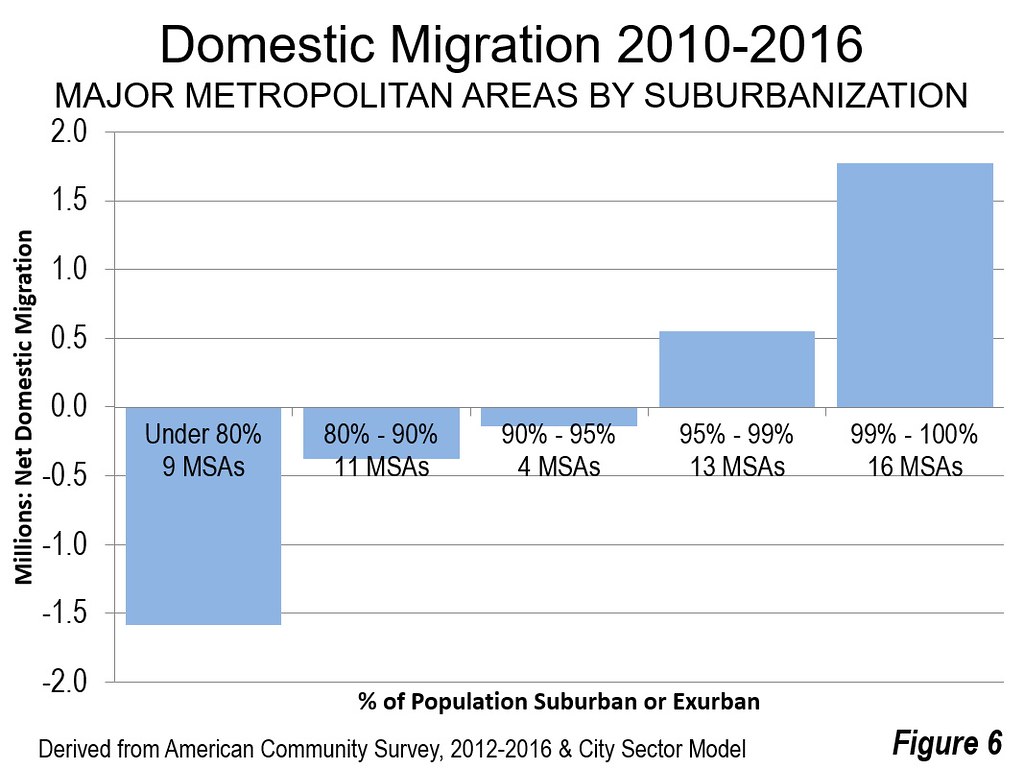
The net domestic migration trends of this decade suggest that suburban and exurban growth will continue to be strong. These data, which reflect all of 2010 to 2016 (unlike the American Community Survey 2012-2016 data), show that the least core-dominated (most suburban) metropolitan areas that virtually monopolize net domestic migration gains (a table with the extent of suburbanization is in America's Most Suburbanized Cities). The 16 metropolitan areas that are 99 to 100 percent suburban gained about 1,775,000 net domestic migrants. The 13 that are 95 to 99 percent suburban gained 550,000. Overall, the 24 metropolitan areas below 95 percent suburban lost 2,100,000 net domestic migrants. Within these, the nine metropolitan areas below 80 percent suburban --- which includes five of the seven with urban cores over 1,000,000 residents --- lost 1,585,000 (Figure 6). Overwhelmingly, people continue to move to the suburbs (except in New York) and especially to the most suburb-dominated metropolitan areas.
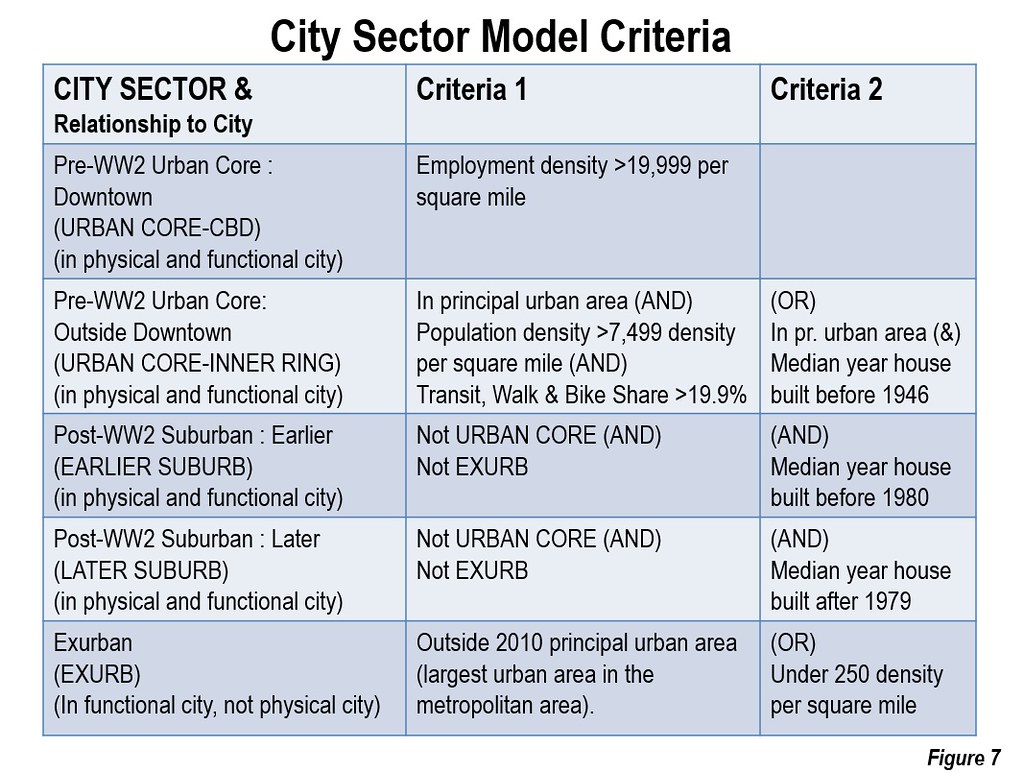
Note: The City Sector Model:
The City Sector Model (Figure 7) classifies population using demographic and land-use factors that changed materially around the time of World War II, after which the automobile sealed its dominance, people walked and used transit less and virtually all new development was at lower densities on the urban periphery (the suburbs and exurbs). Using small area data (zip codes), the City Sector Model produces far more accurate estimates of urban form and lifestyles (such as commuting) than can be obtained from the jurisdictional data that has been used for decades. The use of municipal data --- central cities as the urban cores versus the balance of the metropolitan area as the suburbs --- overstated or understated the extent of the urban core or the suburbs, depending on the metropolitan area. In New York, for example this approach overstated the extent of the suburbs by including places like Jersey City, North Bergen, Hoboken and Union City as suburbs, despite their urban form and lifestyles that are demonstrably urban core. In other metropolitan areas, such as Phoenix, San Jose and Kansas City, the extent of the urban core was wildly exaggerated because they incorporated large suburban areas. Additional background will be found in "Measuring Urban Cores and Suburbs in the United States," in Infinite Suburbia edited by Alan Berger and Joel Kotkin.
Wendell Cox is principal of Demographia, an international public policy and demographics firm. He is a Senior Fellow of the Center for Opportunity Urbanism (US), Senior Fellow for Housing Affordability and Municipal Policy for the Frontier Centre for Public Policy (Canada), and a member of the Board of Advisors of the Center for Demographics and Policy at Chapman University (California). He is co-author of the "Demographia International Housing Affordability Survey" and author of "Demographia World Urban Areas" and "War on the Dream: How Anti-Sprawl Policy Threatens the Quality of Life." He was appointed to three terms on the Los Angeles County Transportation Commission, where he served with the leading city and county leadership as the only non-elected member. He served as a visiting professor at the Conservatoire National des Arts et Metiers, a national university in Paris.
Photograph: Rockefeller Center, New York (by author)


