
Despite planning efforts to restrict it, the Bay Area continues to disperse. For decades, nearly all population and employment growth in the San Jose-San Francisco Combined Statistical Area has been in the suburbs, rather than in the core cities of San Francisco and Oakland. The CSA (Note) is composed of seven adjacent metropolitan areas (San Francisco, San Jose, Santa Cruz, Santa Rosa, Vallejo, Napa, and Stockton). A similar expansion also occurred in the New York CSA.
The San Francisco Bay Area is home to two of the three most dense built-up urban areas in the United States, the San Francisco urban area, (6,266 residents per square mile or 2,419 per square kilometer) with the core cities of San Francisco and Oakland and the all-suburban San Jose urban area (5,820 residents per square mile or 2,247 per square kilometer), according to US Census 2010 data. Only the Los Angeles urban area is denser (6,999 per square mile or 2.702 per square kilometer). The more spread out New York urban area trails at 5,319 per square mile (2,054 per square kilometer).
The San Francisco Bay & Central Valley Area
The continuing dispersion was reflected in commuting patterns that developed between 2000 and 2010, with the addition of the Stockton metropolitan area, which is composed of San Joaquin County, with more than 700,000 residents. San Joaquin County is located in the Central Valley and is so far removed from San Francisco Bay that it may be appropriate in the long run to think of the area as the "San Francisco Bay & Central Valley Area." The distance from Stockton to the closest point shore of San Francisco Bay is 60 miles, and it is nearly another 25 miles to the city of San Francisco.
Ironically, this continued dispersion of jobs and residences is, at least in part, driven by the San Francisco Bay Area's urban containment land use policies designed to prevent it. What the planners have ignored is the impact on house prices associated with highly restrictive land use planning. The San Francisco metropolitan area and the San Jose metropolitan area are the third and fourth most unaffordable major housing markets out of 85 rated in the recent 10th Annual Demographia International Housing Affordability Survey, trailing only Hong Kong and Vancouver.
Historical Core Cities: San Francisco and Oakland
The historical core municipalities (cities) of the San Francisco Bay Area, San Francisco and Oakland have held their population very well. Each essentially retains it 1950 borders. Among the 40 US cities with more than 250,000 residents in 1950, only San Francisco and Oakland managed population increases by 2000 without substantial annexations and substantial non-urban (rural) territory within their city limits. For example, New York and Los Angeles, both of which have grown, have nearly the same city limits as in 1950 and 2000, yet much of New York's Staten Island was rural in 1950 as was much of the San Fernando Valley in Los Angeles.
Yet both San Francisco and Oakland have had difficult times. Between 1950 and 1980, both San Francisco and Oakland suffered 12 percent population losses, which were followed by recoveries. The losses were modest compared to the emptying out of municipalities like St. Louis. Detroit, Chicago, Copenhagen, and Paris, which remain one quarter to nearly two-thirds below their 1950s figures. Further, population gains from annexations masked losses within the 1950 boundaries of many cities, such as Portland, Seattle, and Indianapolis, etc.
San Jose: Now the Largest City
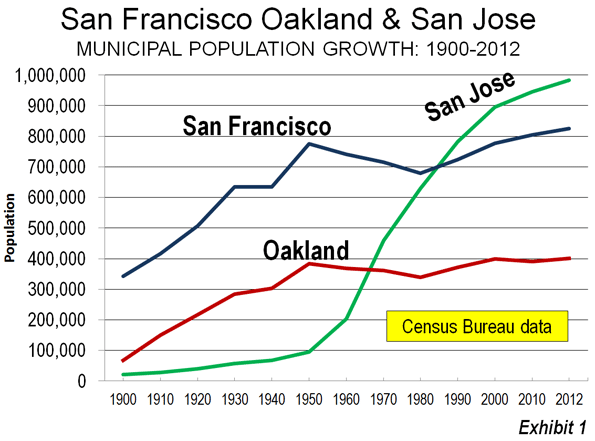
San Jose is now the Bay Area's largest city. San Jose has grown spectacularly, from a population of 95,000 in 1950 to nearly 1,000,000 today. San Jose passed San Francisco by the 1990 census and Oakland by the 1970 census (Figure 1). Virtually all of San Jose's population growth has occurred during the postwar period of automobile suburbanization. The pre-automobile urban form familiar in San Francisco and central Oakland simply does not exist in San Jose. Even attempts to pretend the pre-war urban form has returned have been famously unsuccessful. Even after building an extensive light rail system, San Jose's transit work trip market share is barely one quarter that of the adjacent San Francisco metropolitan area.
Nonetheless, suburban San Jose has become a dominant force in the "Silicon Valley", which stretches through San Mateo County in the San Francisco metropolitan area and into Santa Clara County, which includes San Jose. The Silicon Valley has been the capital of the international information technology business for at least a half century. The highly suburbanized region has done more than its share to elevate the San Francisco Bay Area to its high standard of living (According to Brookings Institution data), a phenomenon that has spread also the urban core of San Francisco. At the same time, San Jose is the second most affluent major metropolitan in the world and San Francisco ranks seventh. The Silicon Valley, which includes much of San Mateo County (adjacent to Santa Clara County in the San Francisco metropolitan area), is clearly the economic engine of the region with twice as many jobs as San Francisco (which is both a city and a county).
Metropolitan Growth
Overall, the San Francisco Bay Area has grown approximately 180 percent since 1950, considerably more than the national average from 1950 to 2012 of 107 percent. The Bay Area's growth was strong, but well behind the 280 percent growth achieved in the Los Angeles CSA (Los Angeles, Riverside-San Bernardino, and Oxnard MSAs).
However, growth has since moderated substantially. Between 1950 and 2000, the Bay Area grew at an annual rate of 1.9 percent but since 2000, the annual growth rate has dropped to 0.7 percent annually. Even so, in recent years, the Bay Area has nearly equaled the much slowed growth of the Los Angeles CSA, adding 23.6 percent to its population since 1990, compared to 25.5 percent in Los Angeles. Both areas, however, grew at less than the national population increase rate (25.8 percent), and slowing, in the 2000s to the slowest growth rates since California became a state in 1850.
Suburban Growth
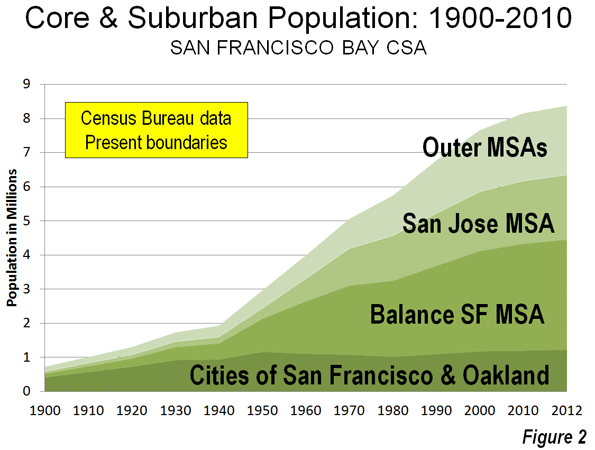
Despite the decent demographic performance of the cities of San Francisco and Oakland since 1950, nearly all Bay Area growth occurred in the suburbs. Between 1950 and 2012, only one percent of population growth in the CSA occurred in the two historical core municipalities and 99 percent in suburban areas. Things have been somewhat better for the two cities since 2000, with seven percent of the growth in the historical core municipalities and 93 percent of the growth in suburban areas (Figure 2).
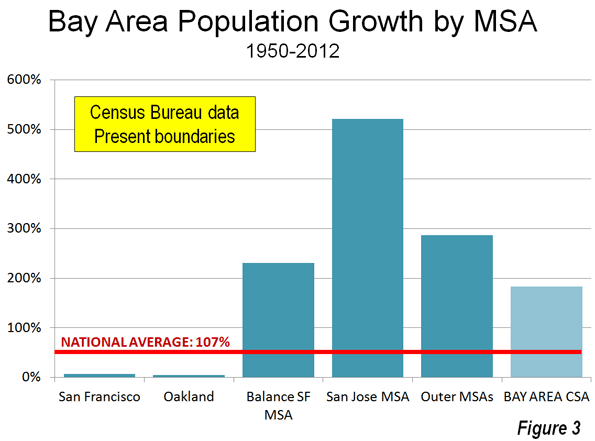
Since 1950, the San Jose metropolitan area has grown by far the fastest in the CSA, with the more than 500 percent increase in population. The outer metropolitan areas (Santa Cruz, Santa Rosa, Vallejo, Napa, and Stockton) have grown nearly 300 percent, while the parts of the San Francisco metropolitan area outside the two core cities grew more than 200 percent. San Francisco and Oakland grew approximately 5 percent (Figure 3).
Domestic Migration
As house prices increased before the subprime crisis, the Bay Area lost more than 600,000 domestic migrants, a rate of more than 85,000 per year. Since 2008, however, with substantially lower house prices, and a renewed tech boom, there has been an annual gain of approximately 4,000 to the Bay Area in domestic migration. However, if the substantial house price increases since 2012 continue, the area could again become a net exporter of people.
Future Urban Evolution
Like much of California, San Francisco Bay CSA exhibits much slower population growth than before. How much of this is tied to the regional and state policies constricting suburban housing remains an open question, but it seems much growth that might have occurred in the original San Francisco metropolitan area or the later developing San Jose metropolitan area will instead occur in the Vallejo or Stockton metropolitan areas, where housing prices tend to be much lower, particularly for larger homes that are increasingly unaffordable closer to the urban core. Indeed, it is not impossible that Modesto (Stanislaus County) could be added to the San Francisco Bay CSA by 2020, which is even farther away from the historical core than the Stockton metropolitan area.
At the same time, many potential new residents may find either the high prices near the core nor the long commutes associated with Central Valley residence unappealing. Many households may instead seek their aspirations in Utah, Colorado, Texas, and even Oklahoma, not least because the "California Dream" has been made affordable.
Wendell Cox is a Visiting Professor, Conservatoire National des Arts et Metiers, Paris and the author of “War on the Dream: How Anti-Sprawl Policy Threatens the Quality of Life.
-----
Note: Metropolitan areas are labor markets. Their building blocks in the United States are complete counties. Metropolitan statistical areas are organized around built up urban areas with counties reaching a threshold of the urban area population being considered central counties and included in the metropolitan area. In addition, any county with an employment interchange of 25 percent or more with the core counties is also included in the metropolitan area. Adjacent metropolitan areas are added together to form Combined Statistical Areas if there is a 15 percent or more employment interchange. This is a simplified definition. Complete details are available from the US Office of Management and the Budget.
Photo: Market Street, San Francisco (by author)


