_–_Frontansicht,_17._Juli_2011,_Mettmann.jpg")
Out of the approximately 150 million employees identified in the American community survey for 2016, nearly 10% are below the poverty level. Popular lore might provide a misleading impression that most of these employees reach work by transit. Other than in the New York metropolitan area, nothing could be further from the truth.
Where Transit is Most Important
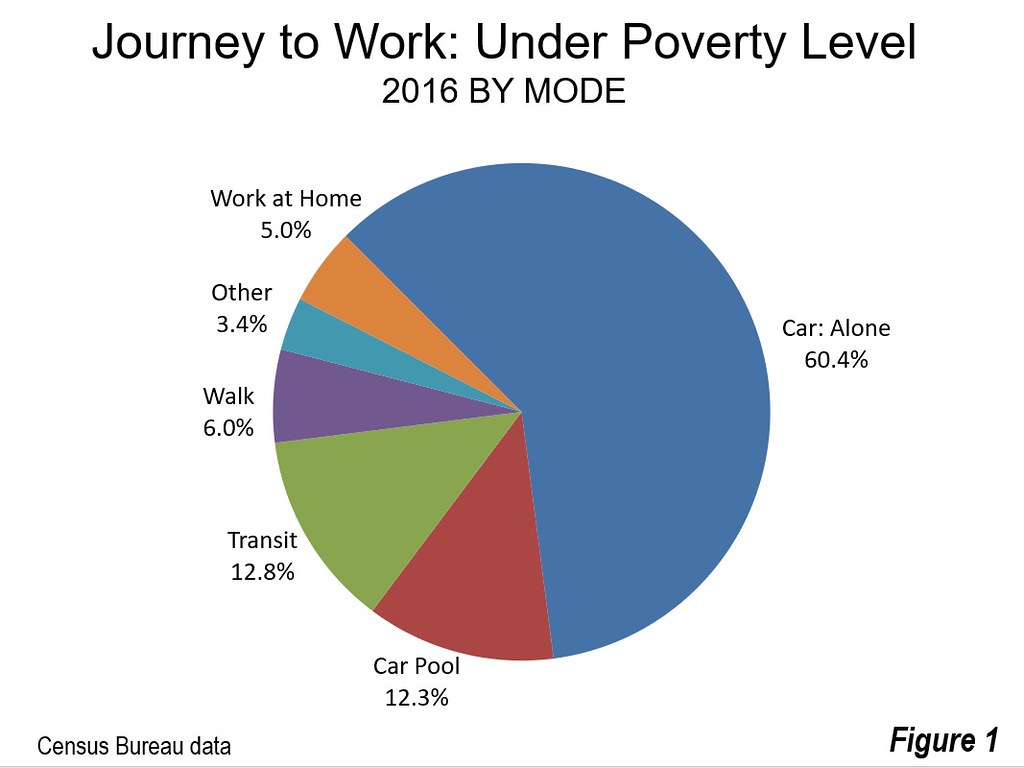
In the 53 major metropolitan areas (those with more than 1 million population), 12.8% of workers in poverty use transit for their work trip. This is a far cry from the 72.7% who use cars, 60.4 percent driving alone and 12.3% in carpools. However, the share of employees in poverty who commute by transit is much closer to that of the overall population. In 2016, 7.9% of workers in the major metropolitan area used transit to get to work. (Figure 1).
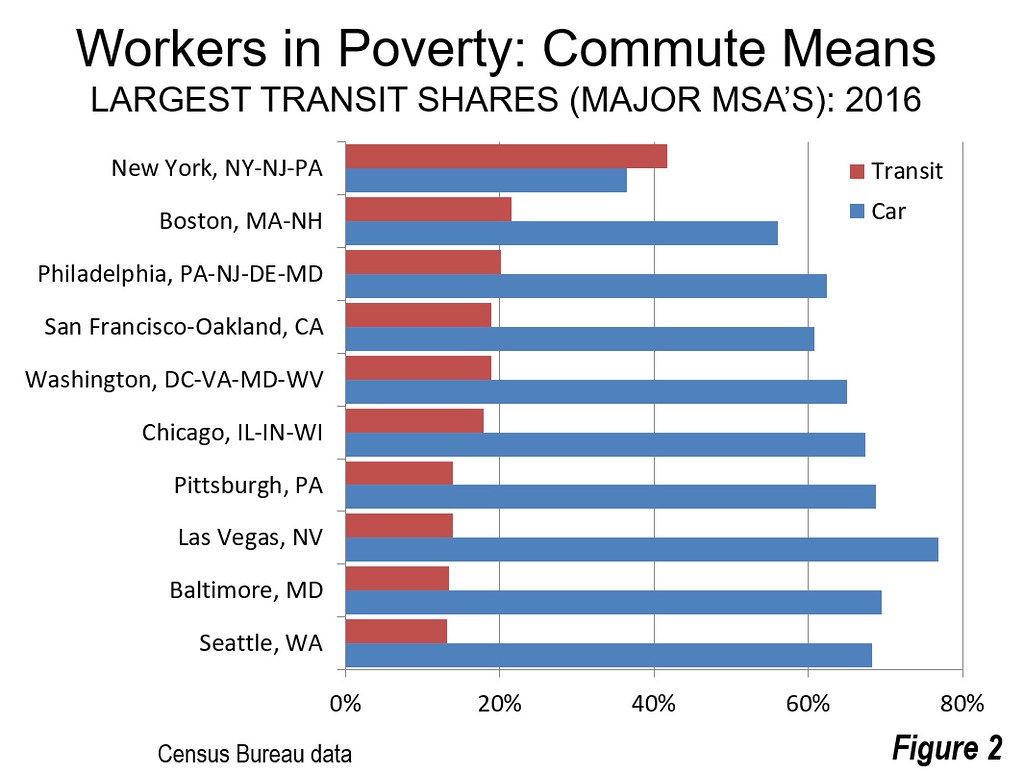
New York is the only major metropolitan area in which employees in poverty use transit more than cars for the work trip. There, 41.7% of work trips are on transit, while 36.5% are by car. But the landscape changes quickly even in the other major metropolitan areas with transit legacy cores. In the Chicago, Philadelphia, San Francisco, Boston and Washington metropolitan areas, around 20% of employees in poverty use transit to get to work. The best transit share is in Boston, at 21.5%. However, 2.6 times as many commuters in poverty use cars (56.5%). In the other four metropolitan areas, cars account for between three and four times as much commuting as transit among the workforce in poverty.
Pittsburgh, Las Vegas, Baltimore and Seattle comprise the balance of the top 10 in transit market share among employees in poverty. In each of these cases cars provide five or more times as much commuting for these low income workers (Figure 2).
However, in nine of the 10 metropolitan areas with the highest market shares among commuters in poverty, the automobile still provides overwhelmingly the largest journey to work share.
Where Transit is Least Important
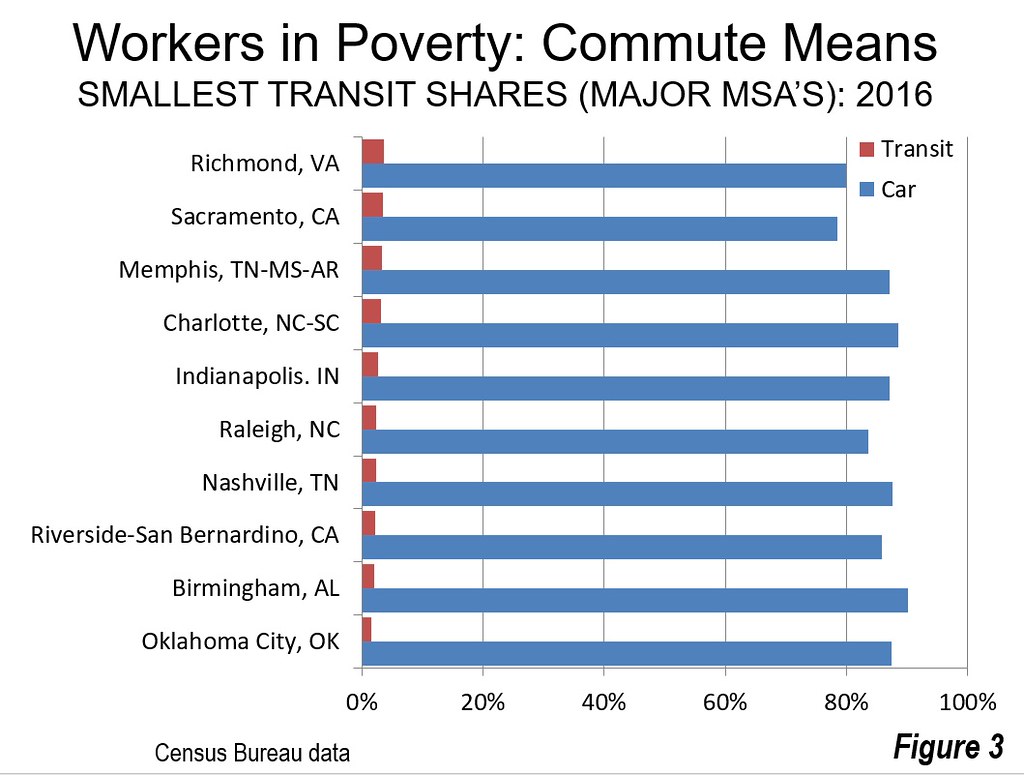
Workers with below poverty incomes used transit the least in Oklahoma City, where the transit share is 1.6%. This compares to an 87.4% share by car, 53 times the number of workers carried by transit. Birmingham ranks second least in transit market share for workers in poverty, at 2.1%, while 42 times as many use cars. Riverside – San Bernardino, Nashville and Raleigh all have automobile market shares that are 30 to 40 times the share for transit among workers in poverty. Charlotte, Memphis, Sacramento and Richmond round out the bottom 10, each with between 20 and 30 times as many commuters in poverty using automobiles as use transit (Figure 3).
Why Low-Income Workers Use Automobiles
It is easy to understand why workers who have earnings below the poverty level predominantly use automobiles. It is simply that so few jobs can be reached in the modern metropolitan area in a reasonable period of time by means of transit.
University of Minnesota research indicates that the average employee in major metropolitan areas can reach far more jobs by car than by transit. The research indicated that the San Francisco metropolitan area had the highest transit access measured by jobs within a 30 mile trip, at 3.5%. This number falls off rapidly in other major metropolitan areas to as low as 0.3% in Riverside and San Bernardino.
In New York, where an astonishingly low 2.5% of jobs are available within 30 minutes by transit, 13 times as many jobs can be reached by car in that time. Among all 49 major metropolitan areas examined, the average employee could reach 43 times as many jobs by car and by transit. What this means is that for most jobs, for most people, a car is an absolute necessity to adequately compete in the labor market.
Longer Term Hope
Obviously, there is no reason to believe that it is remotely possible to efficiently connect the vast majority of workers, whether or not in poverty, with their jobs by transit. However, there is substantial hope. With transit connections so sparse and the cost of driving beyond the financial means of many low income citizens, autonomous cars in the future could cost-effectively provide mobility throughout the metropolitan area that makes it possible for many more people to work. That would be good not only for people unemployed today, but also for the economy.
The car in transit work trip market shares for employees in poverty is indicated in the table below.
| Journey to Work: Employed Persons Below Poverty Level | |||
| Major Metropolitan Areas: 2016 | |||
| Metropolitan Area | Commute by Car | Commute by Transit | Car Times Transit |
| Atlanta, GA | 81.3% | 8.4% | 9.6 |
| Austin, TX | 78.7% | 8.5% | 9.3 |
| Baltimore, MD | 69.5% | 13.4% | 5.2 |
| Birmingham, AL | 90.2% | 2.1% | 42.4 |
| Boston, MA-NH | 56.1% | 21.5% | 2.6 |
| Buffalo, NY | 76.4% | 11.8% | 6.5 |
| Charlotte, NC-SC | 88.5% | 3.2% | 27.3 |
| Chicago, IL-IN-WI | 67.4% | 18.0% | 3.8 |
| Cincinnati, OH-KY-IN | 75.6% | 8.3% | 9.1 |
| Cleveland, OH | 76.7% | 10.6% | 7.2 |
| Columbus, OH | 81.2% | 3.6% | 22.4 |
| Dallas-Fort Worth, TX | 86.1% | 3.6% | 23.6 |
| Denver, CO | 74.7% | 9.1% | 8.2 |
| Detroit, MI | 83.4% | 5.4% | 15.3 |
| Grand Rapids, MI | 80.5% | 8.2% | 9.8 |
| Hartford, CT | 71.7% | 9.0% | 7.9 |
| Houston, TX | 86.5% | 3.6% | 23.9 |
| Indianapolis. IN | 87.1% | 2.7% | 32.3 |
| Jacksonville, FL | 80.3% | 6.6% | 12.2 |
| Kansas City, MO-KS | 87.0% | 3.7% | 23.3 |
| Las Vegas, NV | 76.9% | 13.9% | 5.5 |
| Los Angeles, CA | 73.0% | 12.1% | 6.0 |
| Louisville, KY-IN | 84.5% | 5.6% | 15.1 |
| Memphis, TN-MS-AR | 87.1% | 3.4% | 25.9 |
| Miami, FL | 77.9% | 10.3% | 7.5 |
| Milwaukee,WI | 76.7% | 10.2% | 7.5 |
| Minneapolis-St. Paul, MN-WI | 71.6% | 12.4% | 5.8 |
| Nashville, TN | 87.7% | 2.4% | 36.6 |
| New Orleans. LA | 77.8% | 7.6% | 10.2 |
| New York, NY-NJ-PA | 36.5% | 41.7% | 0.9 |
| Oklahoma City, OK | 87.4% | 1.6% | 53.4 |
| Orlando, FL | 82.8% | 5.8% | 14.3 |
| Philadelphia, PA-NJ-DE-MD | 62.5% | 20.2% | 3.1 |
| Phoenix, AZ | 81.1% | 5.3% | 15.3 |
| Pittsburgh, PA | 68.8% | 14.0% | 4.9 |
| Portland, OR-WA | 69.0% | 11.6% | 6.0 |
| Providence, RI-MA | 83.5% | 6.1% | 13.7 |
| Raleigh, NC | 83.5% | 2.4% | 34.5 |
| Richmond, VA | 79.9% | 3.6% | 22.3 |
| Riverside-San Bernardino, CA | 85.9% | 2.3% | 37.8 |
| Rochester, NY | 77.3% | 9.3% | 8.3 |
| Sacramento, CA | 78.5% | 3.6% | 22.1 |
| St. Louis,, MO-IL | 80.4% | 11.1% | 7.3 |
| Salt Lake City, UT | 70.9% | 12.2% | 5.8 |
| San Antonio, TX | 82.0% | 6.8% | 12.0 |
| San Diego, CA | 74.6% | 7.0% | 10.7 |
| San Francisco-Oakland, CA | 60.8% | 19.0% | 3.2 |
| San Jose, CA | 77.3% | 8.1% | 9.5 |
| Seattle, WA | 68.3% | 13.2% | 5.2 |
| Tampa-St. Petersburg, FL | 80.4% | 5.7% | 14.1 |
| Tucson, AZ | 78.6% | 7.4% | 10.7 |
| Virginia Beach-Norfolk, VA-NC | 79.2% | 7.6% | 10.4 |
| Washington, DC-VA-MD-WV | 65.1% | 18.9% | 3.4 |
| Major MSAs | 72.7% | 12.8% | 5.7 |
| Source: American Community Survey 2016 | |||
Wendell Cox is principal of Demographia, an international public policy and demographics firm. He is a Senior Fellow of the Center for Opportunity Urbanism (US), Senior Fellow for Housing Affordability and Municipal Policy for the Frontier Centre for Public Policy (Canada), and a member of the Board of Advisors of the Center for Demographics and Policy at Chapman University (California). He is co-author of the "Demographia International Housing Affordability Survey" and author of "Demographia World Urban Areas" and "War on the Dream: How Anti-Sprawl Policy Threatens the Quality of Life." He was appointed to three terms on the Los Angeles County Transportation Commission, where he served with the leading city and county leadership as the only non-elected member. He served as a visiting professor at the Conservatoire National des Arts et Metiers, a national university in Paris.
Photograph: Sport Utility Vehicle via WikiMedia Commons


_%E2%80%93_Frontansicht,_17._Juli_2011,_Mettmann.jpg)