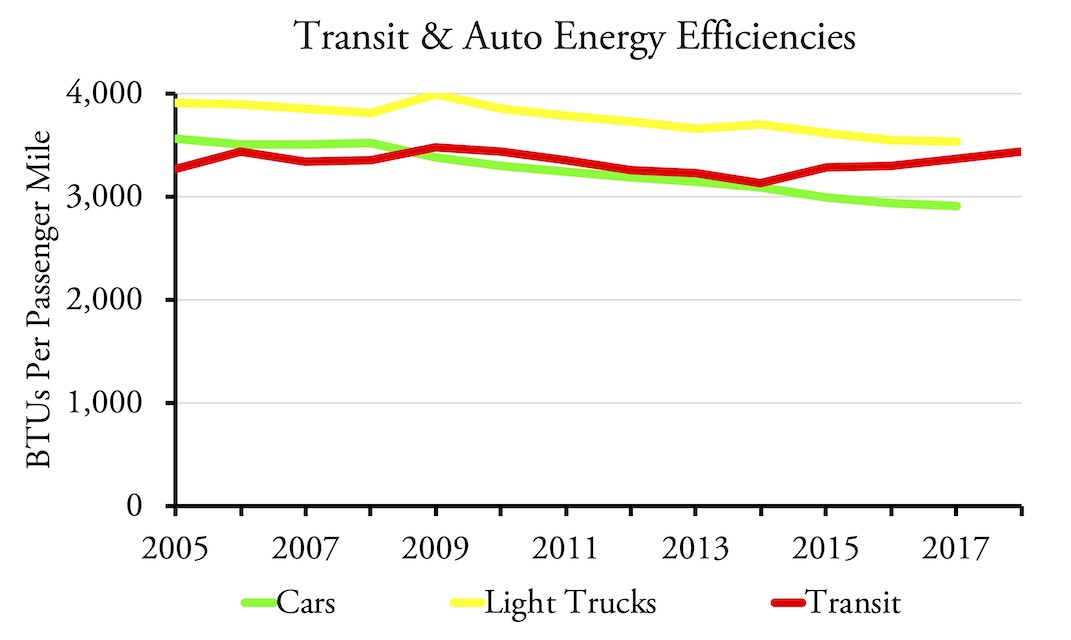
Transit is often touted as a way to save energy. But since 2009 transit has used more energy, per passenger mile, than the average car. Since 2016, transit has used more than the average of cars and light trucks together.
Automobiles and planes are becoming more energy efficient each year. But the annual reports of the National Transit Database reveals that urban transit is moving in the opposite direction, requiring more energy to move each passenger one mile in each of the last four years.
Click cover image above to download a four-page PDF of this policy brief.
Transit has been less energy efficient than the average car since 2009. Light trucks (vans, pickups, SUVs) may soon become more efficient than transit as well. 2018 automobile data are not yet available; 2017 numbers are estimated from this report; prior years are from the Transportation Energy Databook.
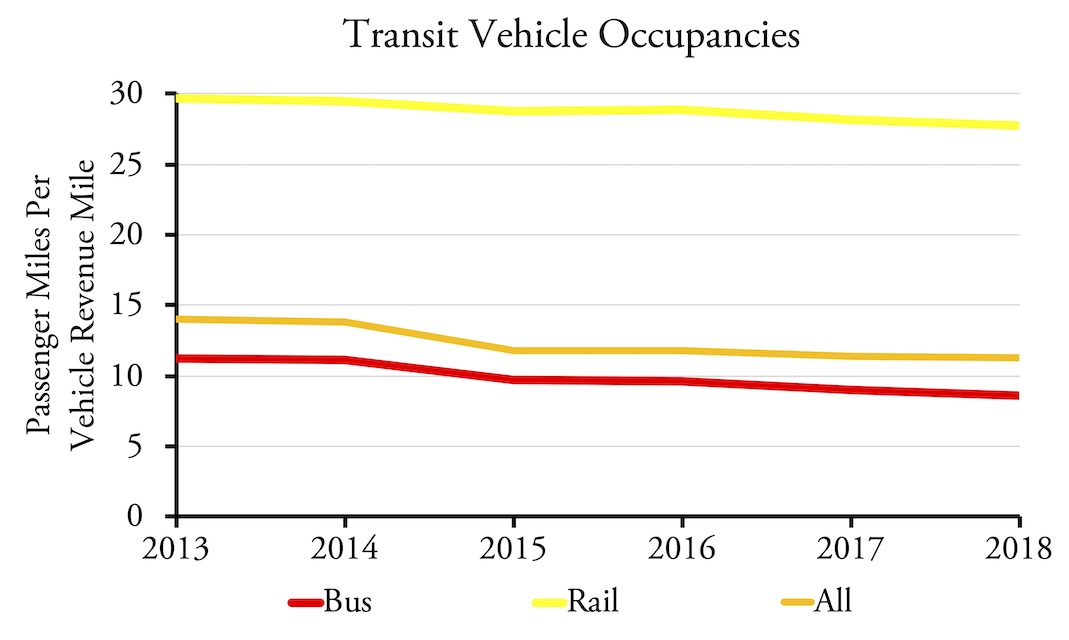
The reason for this is simple: ridership is declining, but transit agencies aren’t proportionately reducing miles of transit service. As a result, the average occupancies of buses and other transit vehicles has declined in every year since 2013. While transit agencies may be purchasing more fuel-efficient vehicles, the increase in average efficiencies per vehicle mile can’t make up for the loss in passengers.
Transit occupancies have steadily declined since 2013. Bus” includes commuter bus, rapid bus, trolley bus, and conventional bus (which the FTA calls “motor bus”). “Rail” includes commuter, heavy, light, and hybrid rail and streetcars, but not monorail or automated guideways. “All” includes all transit, not just bus and rail.
These numbers are based on the National Transit Database, which reports the number of gallons of Diesel fuel, gasoline, natural gas, and other fuels as well as the number of kilowatt-hours of electricity that are used by transit systems across the country. I’ve converted these numbers to British thermal units (BTUs) using standard factors, such as that a gallon of Diesel fuel has 138,500 BTUs.
For electricity, I also took into account the fact that two-thirds of the energy used in a power plant is lost in generation and transmission. In other words, in order to deliver 1 kilowatt-hour (3,412 BTUs) of energy to a customer, an electrical system must consume the equivalent of 10,236 BTUs of fossil fuels or other energy at the power plant. Electric motors tend to be more efficient than internal combustion engines, but when the losses from generation and transmission are accounted for, the efficiencies are about the same.
Energy Consumption by Mode
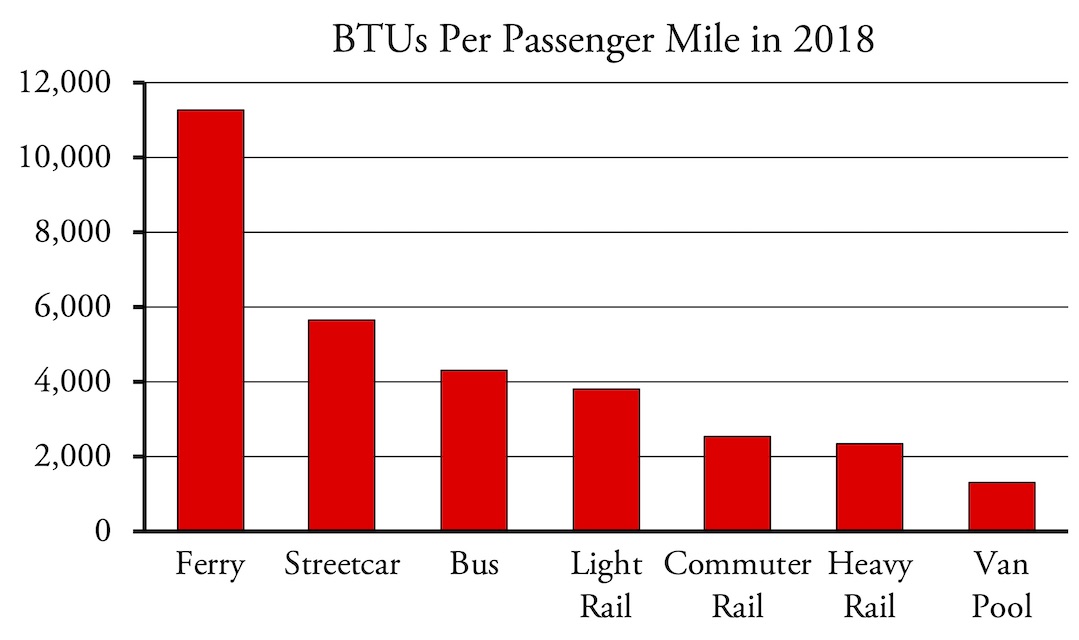
The calculations show that ferries and streetcars use huge amounts of energy per passenger mile, as do automated guideways (i.e., people movers), which aren’t shown in the chart but average even more energy per passenger mile than ferries. Buses and light rail are well above the average automobile.
Ironically, the most energy-efficient transit mode–van pools–is the one that is based on conventional automobiles rather than large buses or railcars.
Commuter and subway/elevated trains (heavy rail) appear to be more efficient, but this is largely because commuter- and heavy-rail numbers are dominated by New York where occupancy rates are high. Commuter rail lines in such regions as Dallas-Ft. Worth, Miami, and even Philadelpha use far more than the average amount of energy per passenger mile, as do heavy rail lines in Baltimore, Boston, Los Angeles, and Miami. Perhaps the biggest surprise is the DC Metrorail, the nation’s second-most heavily used rail system, which consumes almost 25 percent more energy per passenger mile than the average light truck used in 2017.
Read the rest of this piece at The Antiplanner.
Randal O'Toole is an economist with forty years of experience critiquing public land, urban, transportation, and other government plans.
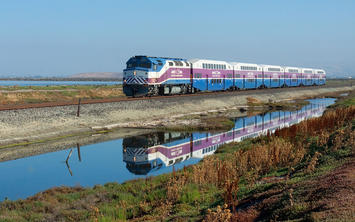
Photo: Jovianeye via Wikimedia under CC 2.0 License.
