,_Queens_County,_NY_HAER_NY,41-QUE,2-21_(cropped).jpg")
The Texas A&M Transportation Institute has released its 2021 Urban Mobility Report, which provides traffic data for the pandemic year of 2020. Throughout much of the year, traffic congestion fell materially. This is confirmed by the 2021 Travel Time Index, which the report defines as the “The ratio of travel time in the peak period to travel time at free‐flow conditions. A Travel Time Index of 1.30 indicates a 20‐minute free‐flow trip takes 26 minutes in the peak period.”
This article analyzes “congestion levels” (the term used by the Tom Tom Traffic Index, which rates international urban areas), converting the Travel Time Index to a percentage signifying the longer travel time due to traffic congestion. For example, a trip that would take 20 minutes in free flow conditions (no congestion), but which takes 26 minutes would have a Transit Time Index of 1.30 (26 divided by 20). The 26-minute travel time (called congestion level here) would be 30% longer than the uncongested time of 20 minutes.
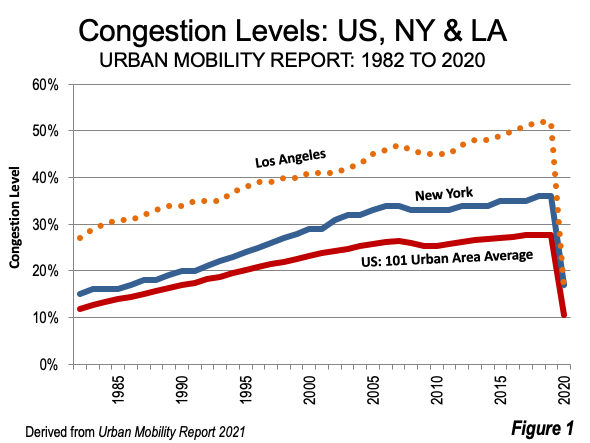
The improved congestion level was substantial. Among the 101 intensively studied urban areas, the congestion level was 11% in 2020, a 62% drop from the 28% rate of 2019. This is below the first year’s (1982) figure of 12% and is the lowest congestion rate in the Urban Mobility Report’s 39 years (Figure 1).
Trend in the 10 Most Congested Urban Areas: 2019
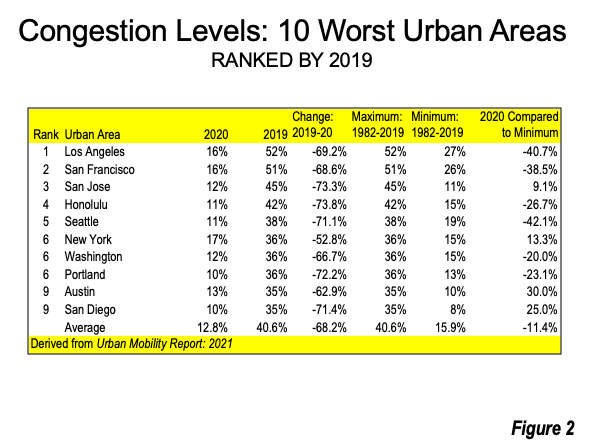
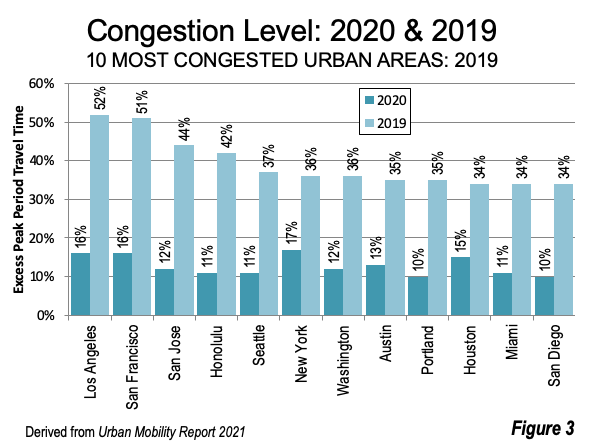
The congestion level improvement was particularly evident in 2020 compared to 2019. New York had the worst congestion level in 2020. Among the 10 urban areas with the highest congestion levels in 2019, six established new minimum records.Four others failed to set new low records, but still enjoyed their best congestion levels in years.In fact, all 10 urban areas registered a better congestion level in 2020 than in any year in more than three decades.
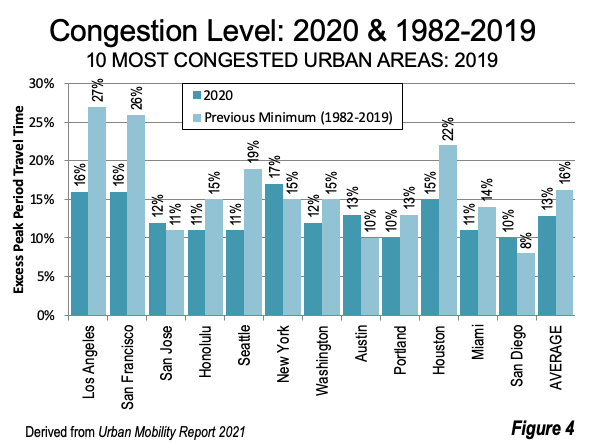
Figure 2 shows 2020 congestion levels compared to 2019, and Figure 3 compares the 2020 congestion levels the all-time previous lows from over the first 38 years of the Urban Mobility Report.
New York: Worst 2020 Traffic Congestion
New York (ranked 6th in 2019) replaced Los Angeles with the highest congestion level, 17% in 2020. Even so, congestion declined significantly --- down 53% from the 2019 figure of 36%. New York’s 2020 congestion level was only slightly above its 38 year low of 15%. However the 2020 congestion level was lower than any year since 1986.
Transit ridership has recovered far less strongly than auto use in New York, which has by far the strongest transit commuting share in the nation. Metropolitan Transit Authority (MTA) data shows that on June 29, New York City subway (including Staten Island) ridership remained 55% below last year. Buses have done a bit better, at a 44% reduction. MTA commuter rail ridership was down even more --- 59% on the Long Island and 62% on the Metro-North. In contrast, the MTA’s auto and truck toll bridges and tunnels were down only 2%.
Six All-Time Minimum Congestion Levels Achieved
Six urban areas had the lowest congestion level ever recorded in the Annual Mobility Report.
The Seattle congestion level of 11% was 42.1% below its previous minimum of 19%. Seattle’s congestion level fell the most relative to its previous minimum. In one year, Seattle’s 2020 congestion level dropped 71.1% from 2019. Seattle experienced the largest drop in its minimum congestion level from the previous 38 years.
The Los Angeles congestion level of 16% was 40.6% below its previous minimum of 27%. The congestion level declined 69.2%, from 52% in 2019 to 16% in 2020. Los Angeles had the worst congestion level in the nation from 1982 to 2019, but had the fourth worst congestion level in 2020.
San Francisco nearly equaled the Los Angeles performance, with a 2020 congestion level 38.3% below its previous minimum. San Francisco had a 2020 congestion level of 16%, down 68.6% from 2019.
Honolulu had a congestion level of 11%, 30.6% below its previous low. Portland’s 10% congestion level bested its previous low by 27.1%. Washington’s congestion level of 12% was 20.0% below its previous low.
Four All-Time Minimum Congestion Levels Not Achieved
Three urban areas among the top 10 other than New York failed to set new minimum records in 2020. San Jose had a congestion level 9.1% above its minimum (12%), but still the best congestion level since 1985. San Diego had a congestion level 25% above its minimum (10%), but the best result since 1985 Austin had a congestion level 30% above its minimum (13%), but the best result since 1988.
Future Congestion Levels: More Like 2020 than 2019?
The authors note that the 2020 data was composed of distinct periods, the initial normal congestion levels before the pandemic in the early part of the year, followed by the huge congestion level reductions of 60 to 75% during the business shutdowns that followed, and then a gradual congestion level increase that reached half of previous levels over the second half of the year.
The drivers of the congestion level improvement were higher unemployment rates and the increase in remote work. Fortunately, the increase in remote work kept the unemployment rate much lower than would have occurred otherwise. The average monthly unemployment rate of 8.1% in 2020 was the same as in 2012.
Yet the congestion levels were markedly different between 2012 and 2020. In 2012, the national congestion level was 26%. In 2020, the national congestion level was 11%, 58% lower. With the employment and unemployment rates virtually the same in 2012 and 2020, the congestion level reduction results to a substantial degree from the enormous increase in remote work. Stanford’s Nicholas Bloom estimated that working at home reached 42% of US full time employment during the pandemic. This is more than seven times the work at home job access figure from 2019 (5.7%).
The benefits were substantial. There was a 50% reduction in annual delay hours, which freed commuters to spend more time at leisure, with their families and other pursuits moreinviting than sitting in traffic.The lower congestion levels converted into considerable environmental benefits, with excess fuel consumption dropping 51% from 2019 to 2020. Greenhouse gas emissions from peak period commutes dropped 50%.
It is notable that the congestion level dropped, with virtually no public expenditure aimed at luring people out of the driver’s seat. In contrast, the principal urban planning strategy has been to substitute transit for driving, which has cost more than $1.5 trillion (2018$) in subsidies over 50 years. This has not reduced congestion levels, which rose substantially from 1982 to 2019, even in urban areas with the best transit service. For example, the New York area, with by far the highest transit ridership in the nation and the largest system experienced a 1982 to 2019 congestion level increase (140%) greater than that of auto oriented Houston (55%).
It is generally expected that flexible, hybrid work arrangements will be more extensive in the future. Many more employees are likely to work full-time or part-time at home and drive to physical workplaces less often. A number of large employers, such Apple, Google, National Insurance and others have announced that they will adopt higher levels of working at home. It is possible that future Urban Mobility Report congestion levels will resemble those of 2020 much more than those of 2019 and before.
Wendell Cox is principal of Demographia, an international public policy firm located in the St. Louis metropolitan area. He is a founding senior fellow at the Urban Reform Institute, Houston, a Senior Fellow with the Frontier Centre for Public Policy in Winnipeg and a member of the Advisory Board of the Center for Demographics and Policy at Chapman University in Orange, California. He has served as a visiting professor at the Conservatoire National des Arts et Metiers in Paris. His principal interests are economics, poverty alleviation, demographics, urban policy and transport. He is co-author of the annual Demographia International Housing Affordability Survey and author of Demographia World Urban Areas.
Mayor Tom Bradley appointed him to three terms on the Los Angeles County Transportation Commission (1977-1985) and Speaker of the House Newt Gingrich appointed him to the Amtrak Reform Council, to complete the unexpired term of New Jersey Governor Christine Todd Whitman (1999-2002). He is author of War on the Dream: How Anti-Sprawl Policy Threatens the Quality of Life and Toward More Prosperous Cities: A Framing Essay on Urban Areas, Transport, Planning and the Dimensions of Sustainability.
Photo: Exchange Plaza, Robert F. Kennedy Bridge (Triborough Bridge), New York, urban area with the nation’s highest congestion level (2020). Credit: Jet Lowe via Library of Congress website under Public Domain.


