
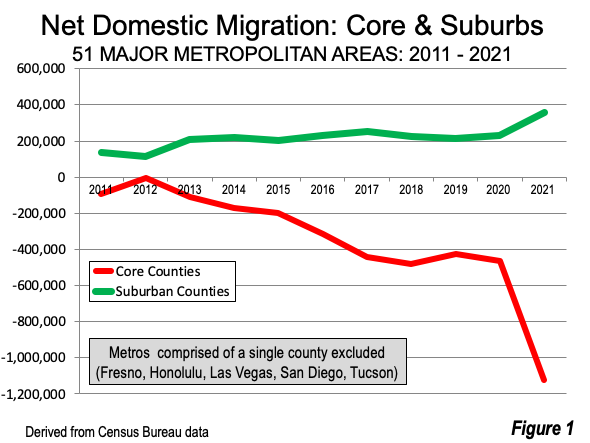
Net domestic migration losses spiked perhaps as never before in the pandemic year of 2021 among urban core counties --- the counties that contain the urban cores (Note 1). This article reviews net domestic migration trend in the major metropolitan areas (over 1,000,000 residents) based on US Census Bureau data for 2021 and going back to 2010. The analysis is limited to 51 of the 56 major metropolitan areas that have more than one county. Since the Census Bureau does not estimate domestic migration below the county level, urban core versus outlying (or suburban) can only be calculated for metros with more than one county (Note 2). As a result, there are no results for Fresno, Honolulu, Las Vegas, San Diego, and Tucson.
Urban Core Counties
Among these urban core counties there was a net loss of 1,122,000 net domestic migrants in 2021. (see Table) This is a 140% increase from the minus 466,000 in 2020 and nearly 10 times the average net domestic migration loss of 115,000 in the first five years of the decade (2010 to 2015). The peak net domestic migration for these metropolitan areas was in 2012, when there was a loss of about 2,000.
In the second half of the decade (2016 to 2020), the average urban core county net domestic migration loss was 425,000, as there was a pronounced shift of net domestic migration away from the larger metropolitan areas to other areas of the country. This was before the spike in net domestic migration that occurred during the COVID-19 pandemic.
Of course, it’s likely that the out-migration will slow as the pandemic wanes. But still, central business districts are particularly vulnerable as many of its long-time workforce labor in “laptop economy jobs” to the shift to on-line work.
Outlying (Suburban) Counties
At the same time, the outer (suburban) counties of the major metropolitan areas experienced a net domestic migration gain of 395,000, their largest gain since 2011. Even as urban core domestic migration was plummeting, the outlying counties experienced a more than 50% increase from their 2016 to 2020 average (231,000), and an even stronger gain relative to earlier in the decade (2011 to 2015), when the average gain was 177,000.
Over the decade the suburban counties added net domestic migrants in every year. The outlying counties gained a minimum of 119,000 more net domestic migrants than the urban core counties (2012), which rose to an average of 656,000 in the last half of the decade. In 2021, the outlying counties gained 1,481,000 more net domestic migrants than the urban core counties. The 2021 results are consistent with research indicating substantial movement away from urban cores, to the periphery of metropolitan areas and even beyond.
Metropolitan Area Highlights
The largest net domestic migration loss occurred in the New York metropolitan area at 385,000. The city of New York accounted for 342,000 of this loss, with a much smaller net out migration of 43,000 from the suburbs.
Metro Los Angeles had the second largest net migration loss at 205,000, with a 180,000 loss in core Los Angeles County.
The San Francisco metropolitan area lost 129,000 net domestic migrants, 56,000 of which were from core San Francisco County and 73,000 from the other four counties (Alameda, Contra Costa, Marin, and San Mateo counties).
Chicago continued its long-lasting string of net domestic migration losses at a minus 107,000 in the metropolitan area. Most of the loss (98,000) was from core Cook County. The outer counties had a relatively modest loss of 9000 net domestic migrants.
The Washington DC-VA-MD-WV metropolitan area lost 67,000 net domestic migrants. The net domestic migration loss in the core city (county equivalent) of Washington, stood at 23.000, while the outlying counties lost a larger 44,000 (only in San Francisco and Washington was the suburban loss greater than the urban core county loss).
Some metropolitan areas that have had strong net domestic migration fell on much harder times in 2021. Seattle had a net domestic migration loss of 31,000 in 2021, after having gained 147.000 between 2010 and 2020. The 2021 loss was concentrated in core King County which lost 33,000 net domestic migrants, while the other two counties had a net domestic migration gain of more than 1,000.
Portland Oregon lost more than 7,000 net domestic migrants, with a 13,000 loss in core Multnomah County, and a suburban gain of 6,000 net domestic migrants. This is after a 129,000 net domestic migration gain in the 2010s.
Denver had a 2021 net domestic migration loss of 7,000, with a 9,000 loss in the city of Denver (county equivalent) and a small gain in the outlying counties. This is after a 204,000 net domestic migration gain between 2010 and 2020.
In Seattle, Portland and Denver, the strong net domestic migration was strongest early in the decade and fell as the decade was closing.
So, if these stellar performers of the last decade lost migrants, which metros gained?
The largest net domestic migration gainer was Phoenix, with 67,000 net domestic migrants. This included a gain of 47,000 in core Maricopa County and 20,000 gained in the other core county. The Maricopa County gain was the largest of any urban core county.
Dallas Fort Worth gained 54,000 net domestic migrants for the second strongest gain. However, core Dallas County had a loss of 45,000, while the outlying counties gained 99,000 net domestic migrants.
Tampa-St. Petersburg had net domestic migration of 42,000, 10,000 to core Hillsborough County, with 32,000 to outlying counties.
Austin had the fourth largest net domestic migration in 2021. However, the core county, Travis, had a small net domestic migration loss (200), with suburban counties accounting for a 41,000 gain.
The situation was similar in Houston where core Harris County lost 44,000 net domestic migrants while the outer counties gained 64,000 for an overall gain of 19,000.
There is increasing evidence that the increased metropolitan core migration losses could continue given the less than robust return to the jobs in the nation’s largest central business districts (downtowns). In San Francisco, it has been projected that ridership on the regional rail system, BART (Bay Area Rapid Transit) may not reach pre-pandemic levels for a decade. The hybrid work and remote work arrangements, that have made the five day work week a thing of the past and facilitated the decentralization are being embraced not only by employees but also by corporate leadership.
Note 1: The urban core counties contain the city hall of the historic core municipality in metropolitan areas. In all but one case the historical core municipality is the largest in the metropolitan area (the exception is the city of Norfolk (county equivalent) in Virginia Beach. In the case of New York, there are five urban core counties, all of which comprise the city of New York.
Note 2: The use of counties for analyzing decentralization in metropolitan areas is not ideal, since there is such great variation among the urban core counties. Some urban core counties contain vast swaths of suburban development, such as Maricopa (Phoenix), with a 2010 urban density of 3,100 per square mile, King (Seattle), at 3,500, Multnomah (Portland) at 4,400 or Bexar (San Antonio (at 3,100) or Fulton (Atlanta) at 2,200. At the same time other urban core counties have little or no suburban development, such as the five New York City counties at 27,000, San Francisco, at 17,000, and Suffolk (Boston), at 12,600. In some cases, the much higher urban densities extend into adjacent counties, especially in Boston and New York. This lack of more local data on domestic migration limits the precision of the analysis. Factors other than net domestic migration can be assessed using census tract or zip code data (such as our City Sector Model).
Wendell Cox is principal of Demographia, an international public policy firm located in the St. Louis metropolitan area. He is a founding senior fellow at the Urban Reform Institute, Houston, a Senior Fellow with the Frontier Centre for Public Policy in Winnipeg and a member of the Advisory Board of the Center for Demographics and Policy at Chapman University in Orange, California. He has served as a visiting professor at the Conservatoire National des Arts et Metiers in Paris. His principal interests are economics, poverty alleviation, demographics, urban policy and transport. He is co-author of the annual Demographia International Housing Affordability Survey and author of Demographia World Urban Areas.
Mayor Tom Bradley appointed him to three terms on the Los Angeles County Transportation Commission (1977-1985) and Speaker of the House Newt Gingrich appointed him to the Amtrak Reform Council, to complete the unexpired term of New Jersey Governor Christine Todd Whitman (1999-2002). He is author of War on the Dream: How Anti-Sprawl Policy Threatens the Quality of Life and Toward More Prosperous Cities: A Framing Essay on Urban Areas, Transport, Planning and the Dimensions of Sustainability.
Photo: Phoenix, AZ — Strongest major metropolitan area net domestic migration 2021
Table 1 (back to reference)
| Net Domestic Migration: Urban Core and Outlying Counties: 2021 | ||||
| Total | Urban Core Counties | Suburban (Outlying) Counties | Suburban Migration Compared to Urban Core | |
| Atlanta, GA | 19,358 | (7,786) | 27,144 | 34,930 |
| Austin, TX | 40,264 | (172) | 40,436 | 40,608 |
| Baltimore, MD | (5,561) | (6,678) | 1,117 | 7,795 |
| Birmingham, AL | (2) | (5,283) | 5,281 | 10,564 |
| Boston, MA-NH | (48,040) | (28,850) | (19,190) | 9,660 |
| Buffalo, NY | (924) | (1,121) | 197 | 1,318 |
| Charlotte, NC-SC | 23,970 | (4,293) | 28,263 | 32,556 |
| Chicago, IL-IN-WI | (106,897) | (98,205) | (8,692) | 89,513 |
| Cincinnati, OH-KY-IN | (213) | (5,268) | 5,055 | 10,323 |
| Cleveland, OH | (6,089) | (10,359) | 4,270 | 14,629 |
| Columbus, OH | 2,487 | (9,799) | 12,286 | 22,085 |
| Dallas-Fort Worth, TX | 54,319 | (44,650) | 98,969 | 143,619 |
| Denver, CO | (6,507) | (9,115) | 2,608 | 11,723 |
| Detroit, MI | (18,841) | (15,857) | (2,984) | 12,873 |
| Grand Rapids, MI | 310 | (2,472) | 2,782 | 5,254 |
| Hartford, CT | 832 | (1,161) | 1,993 | 3,154 |
| Houston, TX | 19,426 | (44,409) | 63,835 | 108,244 |
| Indianapolis, IN | 6,732 | (10,836) | 17,568 | 28,404 |
| Jacksonville, FL | 24,815 | 646 | 24,169 | 23,523 |
| Kansas City, MO-KS | 748 | (1,732) | 2,480 | 4,212 |
| Los Angeles, CA | (204,776) | (179,757) | (25,019) | 154,738 |
| Louisville, KY-IN | (358) | (4,458) | 4,100 | 8,558 |
| Memphis, TN-MS-AR | (3,041) | (6,132) | 3,091 | 9,223 |
| Miami, FL | (55,305) | (44,787) | (10,518) | 34,269 |
| Milwaukee,WI | (8,780) | (12,764) | 3,984 | 16,748 |
| Minneapolis-St. Paul, MN-WI | (15,462) | (18,903) | 3,441 | 22,344 |
| Nashville, TN | 12,328 | (14,770) | 27,098 | 41,868 |
| New Orleans, LA | (9,824) | (6,699) | (3,125) | 3,574 |
| New York, NY-NJ-PA | (385,455) | (342,449) | (43,006) | 299,443 |
| Oklahoma City, OK | 10,224 | (1,277) | 11,501 | 12,778 |
| Orlando, FL | 4,019 | (16,184) | 20,203 | 36,387 |
| Philadelphia, PA-NJ-DE-MD | (14,763) | (28,226) | 13,463 | 41,689 |
| Phoenix, AZ | 66,850 | 46,866 | 19,984 | (26,882) |
| Pittsburgh, PA | (3,993) | (7,635) | 3,642 | 11,277 |
| Portland, OR-WA | (7,441) | (12,983) | 5,542 | 18,525 |
| Providence, RI-MA | 2,427 | (2,427) | 4,854 | 7,281 |
| Raleigh, NC | 21,743 | 10,518 | 11,225 | 707 |
| Richmond, VA | 6,788 | (887) | 7,675 | 8,562 |
| Riverside-San Bernardino, CA | 34,859 | 3,608 | 31,251 | 27,643 |
| Rochester, NY | (2,938) | (3,381) | 443 | 3,824 |
| Sacramento, CA | 6,963 | (2,639) | 9,602 | 12,241 |
| St. Louis,, MO-IL | (7,277) | (7,577) | 300 | 7,877 |
| Salt Lake City, UT | (4,629) | (7,447) | 2,818 | 10,265 |
| San Antonio, TX | 25,660 | 4,687 | 20,973 | 16,286 |
| San Francisco, CA | (128,870) | (55,631) | (73,239) | (17,608) |
| San Jose, CA | (52,932) | (54,801) | 1,869 | 56,670 |
| Seattle, WA | (31,489) | (32,802) | 1,313 | 34,115 |
| Tampa-St. Petersburg, FL | 42,089 | 9,600 | 32,489 | 22,889 |
| Tulsa, OK | 6,757 | 965 | 5,792 | 4,827 |
| Virginia Beach-Norfolk, VA-NC | (321) | (3,540) | 3,219 | 6,759 |
| Washington, DC-VA-MD-WV | (66,811) | (23,030) | (43,781) | (20,751) |
| TOTAL | (763,571) | (1,122,342) | 358,771 | 1,481,113 |
| Derived from US Census Bureau data | ||||
| Excludes metropolitan areas with only one county (Fresno, Honolulu, Las Vegas, San Diego & Tucson) | ||||


Politically speaking
the "blue" urban cores benefitted greatly from the 2020 Census capturing a moment ahead of the biggest outward wave.