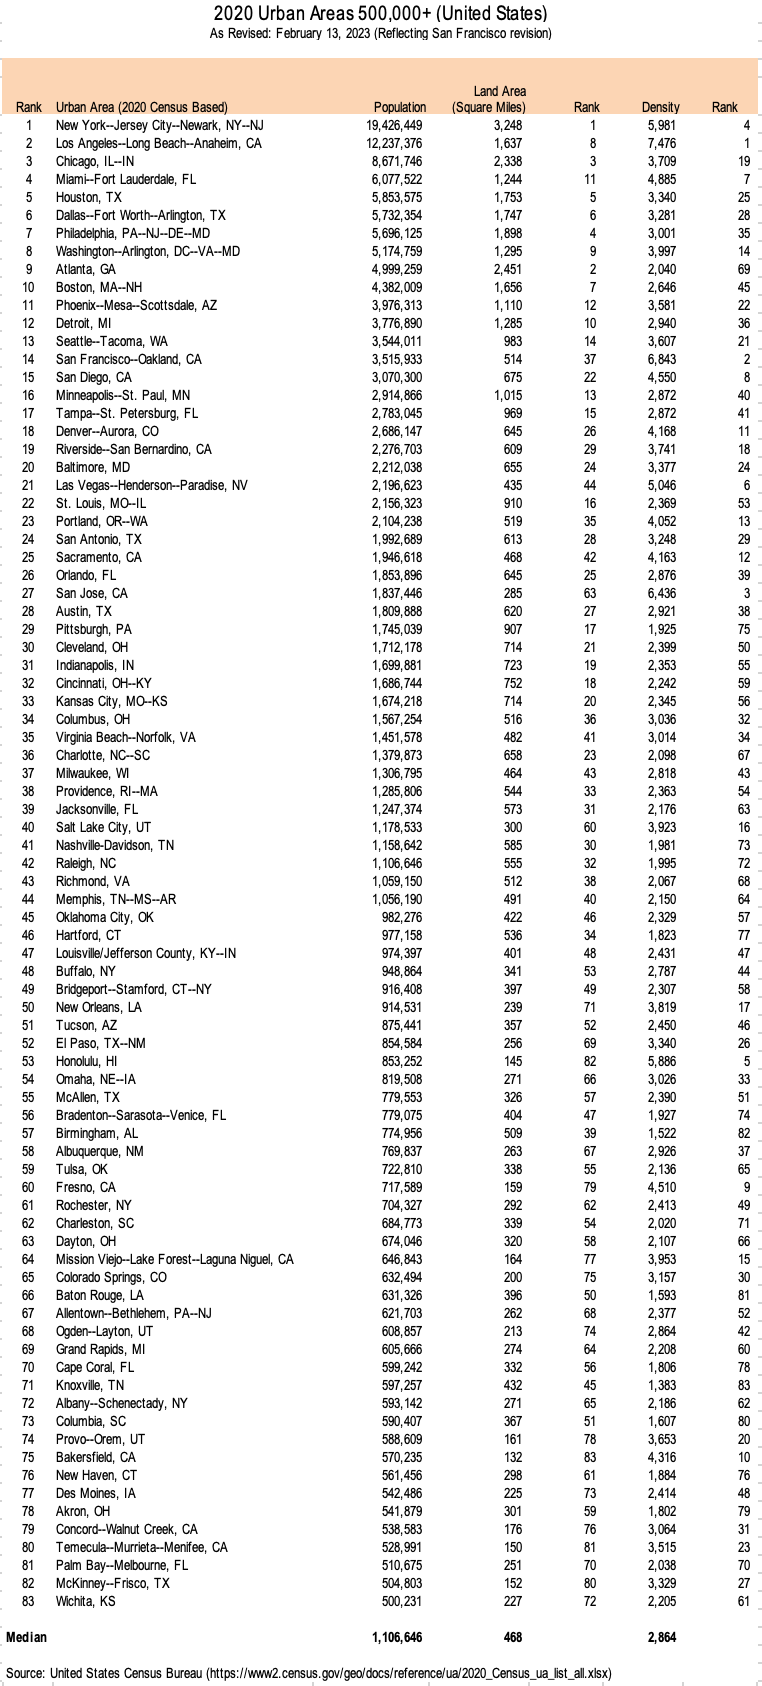
Note: This is a revised version., which reflects a correction by the Census Bureau to the San Francisco-Oakland urban area, into which has been combined the San Rafael-Novato urban area. San Francisco-Oakland remains the 14th largest urban area, but now ranks behind Los Angeles in density. The revised data is in the table at the end of this article. The fully revised replacement article is available here. The complete urban area data is available at www2.census.gov/
The Census Bureau has announced the new urban areas, following releases that began with the 1950 release of “urbanized area” data. The population, land area and population density of the larger urban areas from 1950 to 2010 is illustrated in this table. Generally, urban areas are settlements of continuous urbanization, as opposed to rural areas.
According to the Census Bureau urban areas are “defined as densely developed residential, commercial, and other nonresidential areas.”
“For the 2020 Census, an urban area will comprise a densely settled core of census blocks that meet minimum housing unit density and/or population density requirements. This includes adjacent territory containing non-residential urban land uses. To qualify as an urban area, the territory identified according to criteria must encompass at least 2,000 housing units or a population of at least 5,000.”
For 2020, the Census Bureau made significant changes by the minimum urban population of 2,500 to one of either 5,000 population or 2,000 housing units. The Census Bureau also made changes to the way that it splits large urban agglomerations (larger areas of continuous urban development), such as San Francisco and San Jose. The criteria also included discontinuance of the term “urbanized area,” replaced by “urban area” regardless of population.
Urban Areas of 500,000 or More Residents
This article highlights the 83 urban areas with 500,000 or more residents in the 50 states and the District of Columbia (revised Table).
The 10 Largest Urban Areas
New York (New York-Jersey City-Newark, NY-NJ) remains the largest urban area (UA), with 19.4 million residents. The New York urban area also has the largest land area, at 3,248 square miles. This gives New York the fourth highest density among the largest urban areas. While it is often presumed that New York is the densest large urban area, that has not been true since the 1990 census, when it was displaced by the Los Angeles UA, with its undeserved reputation for being the ultimate in urban sprawl.
Los Angeles (Los Angeles-Long Beach-Anaheim) is the second largest urban area, a position it has held since the 1960 census, with 12.2 million residents in 2020. The Los Angeles UA covers 1,637 square miles, but the Los Angeles UA ranks only 8th in land area among the 83 with more than 500,000, including more sprawling New York Chicago, Houston, Dallas-Fort Worth, Philadelphia, Atlanta and Boston UAs, the latter with barely a third the population of Los Angeles UA. The Los Angeles population density is 7,476 residents per square mile, which makes it the densest among the larger urban areas (The key to the high Los Angeles UA density is its small single-family lot size (photograph above). This is typical of urban California, which has 35 of the 43 urban areas of all sizes in the nation, with more than 5,000 residents per square mile.
Chicago, IL-IN is the third largest urban area, with 8.7 million residents. The Chicago UA covers 2,338 square miles, the third largest urban expanse after New York and Atlanta. The Chicago UA density is 3,709 residents per square mile, for a rank of 28th among the 83 UAs with half a million population.
Miami (Miami-Fort Lauderdale) is the fourth largest urban area, at 6.1 million population. Its 1,244 square mile land area is ranked 11th among the 83 UAs. Miami’s population density is 4,885 per square mile, for a 7th ranking.
Houston is the fifth largest urban area, with 5.9 million residents. The land area is 1,753 square miles and ranks fifth. Houston’s population density is 3,340 per square mile, for a 25th place ranking.
Dallas-Fort Worth (Dallas-Fort Worth-Arlington) is the sixth largest urban area, with 5.7 million residents. The Dallas-Fort Worth UA fell behind in-state rival Houston, which was smaller in 2010. The difference can be explained by the creation of a new urban area, Frisco-McKinney part of which was previously in the Dallas-Fort Worth UA. The city of Frisco, formerly in the Dallas-Fort Worth UA had a 2020 population of 201,000, more than the 121,000 Dallas-Fort Worth difference with Houston. The Dallas-Fort UA covers 1,747 square miles, ranking sixth. The population density is 3,281 per square mile and ranks 28th out of the 83 urban areas.
Philadelphia, PA-NJ-DE-MD is the seventh largest urban area, with 5.7 million residents in a land area of 1,898 square miles, the fourth largest following New York, Atlanta and Chicago. The Philadelphia urban area population density is 3,001, ranking 35th.
Washington (Washington-Arlington, DC-VA-MD) is the eighth largest urban area, with 5.2 million residents. The urban area covers 1,295 square miles and is ranked 9th. The population density is 3,997 per square mile for a ranking of 35th.
Atlanta is the ninth largest urban area, with 5.0 million residents. Its land area of 2,451 square miles is the second largest among the newly announced urban areas. The population density of 2,040 ranks 70th out of the 83 urban areas.
Boston, MA-NH is the 10th largest urban area, with 4.4 million residents. Boston’s land area is 1,656 square miles and ranks as the 7th largest. This perhaps surprisingly low urban density is, like Atlanta, lower than the median 500,000+ density (2,841) of the 83 urban areas.
Other Observations
San Francisco-Oakland, has been revised to include the San Rafael-Novato urban area, increasing its population from 3.2 million to 3.5 million. San Francisco’s rank remains the same, at 14th, behind Seattle and ahead of San Diego. Though not among the 10 largest UA’s, now has the second highest urban density, at 6,843 per square mile.
National Urban Population
The impact of the new criteria is a slight reduction in the nation’s urban population share. There are 265.1 million urban residents, or 80.0% of the total population, down from 80.7% under the previous criteria in 2010. But, like any significant redefinition of criteria (as was also the case in the 2000 revision), valid comparison to earlier years, such as in urban density, are impossible without considerable research and caveats.
Note: The author also produces Demographia World Urban Areas. The 2022 edition provides population, urban land area and urban population density for the nearly 1,000 identified urban areas in the world with 500,000 population or more.
Wendell Cox is principal of Demographia, an international public policy firm located in the St. Louis metropolitan area. He is a founding senior fellow at the Urban Reform Institute, Houston, a Senior Fellow with the Frontier Centre for Public Policy in Winnipeg and a member of the Advisory Board of the Center for Demographics and Policy at Chapman University in Orange, California. He has served as a visiting professor at the Conservatoire National des Arts et Metiers in Paris. His principal interests are economics, poverty alleviation, demographics, urban policy and transport. He is co-author of the annual Demographia International Housing Affordability Survey and author of Demographia World Urban Areas.
Mayor Tom Bradley appointed him to three terms on the Los Angeles County Transportation Commission (1977-1985) and Speaker of the House Newt Gingrich appointed him to the Amtrak Reform Council, to complete the unexpired term of New Jersey Governor Christine Todd Whitman (1999-2002). He is author of War on the Dream: How Anti-Sprawl Policy Threatens the Quality of Life and Toward More Prosperous Cities: A Framing Essay on Urban Areas, Transport, Planning and the Dimensions of Sustainability.
Photo: Los Angeles suburbs compared to New York suburbs at 35 miles from urban core (By author).
Table 1 (back to reference)