NewGeography.com blogs
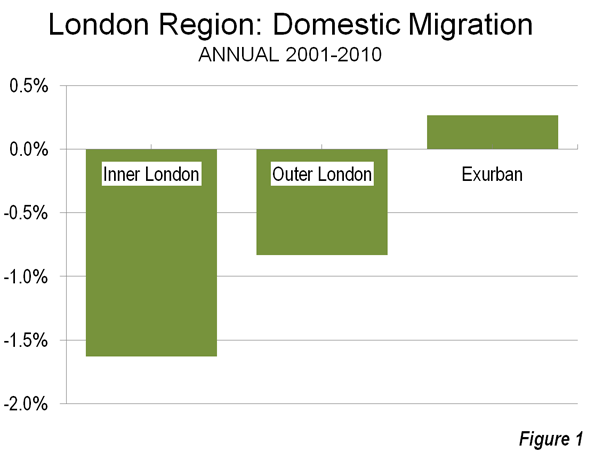
As reported in The Evolving Urban Form: London, last July the Greater London Authority (GLA), located inside the Green Belt, grew strongly from 2001 to 2011, though remains well below its peak estimated population in 1939. Substantial domestic migration from the core area to the exurbs was a major contributor to their growth during between 2000 and 2010 (Figure 1).
Obviously, with all that growth and all that domestic out-migration, international migration had to be driving the population growth in the GLA. The British Broadcasting Corportation (BBC) confirms that, reporting that, for the first time "white British" residents of GLA represent a minority of the population. At 45 percent, this population segment is down from 58 percent in 2011.
Whites, however, remain a majority, with more than 1.3 who do not consider themselves British, according to the 2011 census data. The combined white population is nearly 60 percent of the GLA total. The table below provides the ethnic data as reported by the Office for National Statistics.
| Greater London Authority: Ethnicity |
|
|
| 2011 Census |
|
|
|
|
|
| All categories: Ethnic group |
8,173,941 |
100.0% |
|
|
|
| White: English/Welsh/Scottish/Northern Irish/British |
3,669,284 |
44.9% |
| White: Irish |
175,974 |
2.2% |
| White: Gypsy or Irish Traveller |
8,196 |
0.1% |
| White: Other White |
1,033,981 |
12.6% |
| Mixed/multiple ethnic group: White and Black Caribbean |
119,425 |
1.5% |
| Mixed/multiple ethnic group: White and Black African |
65,479 |
0.8% |
| Mixed/multiple ethnic group: White and Asian |
101,500 |
1.2% |
| Mixed/multiple ethnic group: Other Mixed |
118,875 |
1.5% |
| Asian/Asian British: Indian |
542,857 |
6.6% |
| Asian/Asian British: Pakistani |
223,797 |
2.7% |
| Asian/Asian British: Bangladeshi |
222,127 |
2.7% |
| Asian/Asian British: Chinese |
124,250 |
1.5% |
| Asian/Asian British: Other Asian |
398,515 |
4.9% |
| Black/African/Caribbean/Black British: African |
573,931 |
7.0% |
| Black/African/Caribbean/Black British: Caribbean |
344,597 |
4.2% |
| Black/African/Caribbean/Black British: Other Black |
170,112 |
2.1% |
| Other ethnic group: Arab |
106,020 |
1.3% |
| Other ethnic group: Any other ethnic group |
175,021 |
2.1% |
|
|
|
| Source: Office for National Statistics, United Kingdom |
|
|
Coal electricity declined by 12.5 percent in 2012, mostly driven by the switch to natural gas, which increased by almost the exact same amount (217 terrawatt-hours) as coal declined (216 TWh), according to new annual numbers released by the US Energy Information Administration.
Wind electricity increased as well — by about one-tenth (20.5 TWh) as much as gas. Solar increased a little more than one-hundredth as much as gas (2.5 TWh).

The figures come at a time when renewable energy advocates have claimed that wind and solar have been responsible for the big declines in coal — claims that do not stand up to scrutiny, according to a new Breakthrough Institute analysis.
Indeed, the new numbers highlight the key difference between gas and solar and wind. Where taxpayers subsidized unconventional gas exploration from 1980 to 2002 to the tune of $10 billion, natural gas in recent years has been replacing coal without subsidies.
Wind and solar, by contrast, remain almost wholly dependent on public support. Uncertainty last year over whether Congress would renew the key wind subsidy meant that less than half as much new wind will be installed in 2013 as was installed in 2012.
Where the problem for wind has been its high cost, the problem for gas is that it has become too cheap. Natural gas production slowed last year in the face of unprofitably low prices caused by overproduction.
This does not mean that subsidies for solar and wind should be cut, only that they should be reformed. Instead of subsidizing the production of electricity from the same old technologies, we need the kind of innovation that allowed natural gas to become cheaper than coal.
This piece first appeared at The Breakthrough.
A recent story over at Atlantic Cities got me thinking about a debate that’s heated up over the last few years: urban parking policy for churches.
Per Atlantic Cities, San Francisco has decided to start charging for metered parking on Sundays. This is starting to happen across America. In San Francisco, as in Chicago and elsewhere, the driver (no pun intended) appears to be revenue raising, plain and simple.
This has angered many attendees of local churches (who have in many cases now moved out of town and drive in for services). They seem to believe that they have a constitutional right to free parking on Sunday mornings. On the other side, of course, are bicycle advocates, who are positively gleeful. (Bicycle advocates are without a doubt the single most self-righteous advocacy group I know, which is why so many people who otherwise might support reasonable pro-bicycling policy can’t stand them).
I think a more nuanced approach should be taken, based on neighborhood conditions and creating the right incentive structures. For example, in some places across the country (San Francisco and Chicago come to mind again), it’s traditional for church goers to park even in what would otherwise be illegal spots. In general, this isn’t a problem – at least from my personal observations in Chicago. Traffic is pretty light on Sunday mornings, and it doesn’t cause any problems.
What’s more, enabling that temporary use of public space for a couple hours on a Sunday morning is exactly the sort of thing we need more of, not less. An institution like a church that has a single demand spike for parking during a generally low demand period is a great candidate for flexible uses of public space that would otherwise be underutilized. Liveable streets advocates are quick to decry the empty lanes off peak from oversized roads. So what’s the problem with putting a boulevard on a “road diet” on Sunday morning by using a lane for parking? Sounds like a winner to me. I’d be asking what other types of institutions or events could do similar things.
And consider, what will happen if churches are banned from using these spots or otherwise have to pay? Well, it depends on the neighborhood, but it’s easy to see what organizations often do when they need parking: build parking lots. Do we really want churches acquiring private off street lots that will sit empty 166 out of 168 hours per week – and generate no property taxes? It makes no sense to me. Why would we want to create incentives for people to own parking lots just because some folks hate cars? We should be going exactly the other direction. There are way too many church parking lots already if you ask me. We should be trying to cut deals with them to open that land up for development by making temporary blocks of street parking available for a couple hours on Sundays.
Now, in places where there is legitimately congestion and/or parking shortages on Sunday mornings (and San Francisco might be a case here – I don’t know for sure), implementing parking charges and restrictions would certainly be reasonable. The principal reason for allowing these church uses in the first place shouldn’t be some religious exemption per se, but rather enabling a local chronologically niche use to take advantage of underutilized public space. (Keep in mind that many other local users get truly special privileges based solely on their local presence: loading zones, valet zones, residential parking – and the latter is usually de facto free). If the space is over-subscribed, then feeding the meters to help rationalize demand is reasonable, and the churches should stop grumbling.
In short, we should be basing this on some type of rational decision process based on neighborhood conditions, setting the right overall incentives, and balancing the needs of competing uses, not pandering to churches treating illegal spots as if they were some ancient feudal right, nor sanctimonious bicyclists behaving as if a double parked car on Sunday morning is a menace to the planet or to their own self-evident status as the most perfectly entitled form of urban transport.
This piece first appeared at The Ubanophile.
Google the phrase “fly-over state.” You will find some unkind and a few nasty characterizations of the states that occupy the middle of the country. Nobody goes to these boring, unremarkable places with their ignorant people, uncultured lifestyles and awful weather. "Fly-over states" are where people never actually go but just fly over to get from the East Coast to the West Coast where the interesting places are.
Now I don't want to disparage the coastal states or their “cool” cities because I have many friends living and working there that I would never dream of offending. But the truth is that the middle of the country is doing quite well and can look forward to a bright future with unaccustomed, uncharacteristic optimism.
The Great Plains turnabout is robust and pervasive, according to “The Rise of the Great Plains,” a report on the future of the American Great Plains recently released by Texas Tech University. Joel Kotkin, Praxis Strategy Group and Kevin Mulligan of TTU’s Center of Geospatial Technology authored the report, which is accompanied by an interactive online atlas of economic, demographic and geographic data.
Instead of being passed over, the region has surpassed the national norms in everything from population increase to income and job growth during the last decade. After generations of net out-migration, the entire region now enjoys a net in-migration from other states, as well as increased immigration from around the world. Contrary to perceptions of the area as a wind-swept, old-age home, the vast majority of the newcomers are between the ages of 20 and 35.
“The Rise of the Great Plains” concludes that three critical factors will propel the region’s future in the 21st century.
First, the region’s vast resources places it in an excellent position to take advantage of worldwide increases in demand for food, fiber and fuel. The region’s manufacturing prowess and increasing trade savvy can propel it into more global markets.
Second, the hyper-evolution and adoption of advanced technologies has enhanced the development of precision agriculture and energy resources, notably oil and gas previously considered impractical to tap. So, too, the Internet and advanced communications have reduced many of the barriers — socio-economic and cultural — which have isolated the Plains from the rest of the country and the world.
Third, and perhaps most significantly, are demographic changes. The reversal of out-migration means that the region is again becoming attractive to people with ambition and talent. This is particularly true of leading cities, many of which now enjoy positive net migration not only from their own rural hinterlands, but from metropolitan areas such as Los Angeles, Minneapolis, the San Francisco Bay Area, New York and Chicago.
Fly-over states forever? Certainly some of the economic realities and perceptions of the Great Plains will persist. Yet, we can accelerate their demise by choosing to make prudent, generative investments in our infrastructure, businesses, institutions, communities and people. By doing so, we ourselves will be empowered to fly over to opportunities wherever they might be found throughout the world.
Delore Zimmerman is the President of Praxis Strategy Group and Publisher of NewGeography.com. This piece originally appeared in Prairie Business Magazine, January 31, 2013.
The release of the 9th Annual Demographia International Housing Affordability Survey on Monday appears to have caused a political storm in New Zealand. This year’s Survey was particularly controversial in New Zealand for two reasons.
Not only did it show deteriorating housing affordability, as measured by a worsening of New Zealand’s ‘median multiple’ (median house price divided by gross annual median household income), but the foreword of the Survey was written by none other than New Zealand’s Finance Minister, Bill English, who had some stern words to say about the state of housing affordability in New Zealand, brought about largely by the strangulation of supply:
“Housing affordability is an important focus for the New Zealand Government . Last year’s New Zealand Productivity Commission report on housing affordability, relying in part on Demographia affordability data, showed a substantial worsening in housing affordability in New Zealand in the last thirty years…
In its response to the Productivity Commission, the Government agreed with the Commission’s analysis that supply side factors explain the deterioration in New Zealand’s housing affordability.
The Government’s response to the Commission’s report concentrated on land supply, infrastructure provision, costs and delays due to regulatory processes, and improving construction sector productivity…
It costs too much and takes too long to build a house in New Zealand. Land has been made artificially scarce by regulation that locks up land for development. This regulation has made land supply unresponsive to demand. When demand shocks occur, as they did in the mid-2000s in New Zealand and around the world, much of that shock translates to higher prices rather than more houses. It simply takes too long to make new land available for development.
We may be seeing the beginning of a repeat of the mid-2000s demand shock. As interest rates stay below historic norms, expectations are shifting that these rates are here to stay. As a result, demand for real assets has increased, observed in booming equities markets in 2012. Demand for real estate is also increasing, with the median house price in Auckland recently exceeding the highs of 2007.
Costs of other housing inputs contribute to New Zealand’s affordability problem. Building materials cost more in New Zealand than neighbouring Australia. The structure of infrastructure financing, and the timing levies are to be paid, raises the market price for housing. Appeals under the Resource. Management Act, New Zealand’s land use regulation, can hold up developments and city planning for a decade or more in some cases. Time is money because development is risky…
Certainly, the affordability situation in New Zealand has, once again, started to deteriorate, with house prices in New Zealand’s two major markets – Auckland and Christchurch – rising strongly over the past two years (see next chart).

In late 2009, the Reserve Bank of New Zealand dropped the official cash rate to just 2.5%, where it has remained ever since. In turn, the discount variable mortgage rate has fallen to just 5.45%, which has fueled a sharp rise in mortgage finance commitments and house prices (see below charts)


At the same time as credit demand has been rising, the supply situation in New Zealand has also deteriorated. The February 2011 Canterbury earthquakes wiped‑out more than 10,000 homes in Christchurch, New Zealand’s second largest city, adding to the already tight housing supply.
Meanwhile, in New Zealand’s largest city – Auckland – the Council has moved to tighten the city’s already highly restrictive urban growth boundary (called the “Metropolitan Urban Limit” or MUL) into an even tighter “Rural Urban Boundary” that would effectively ban development outside of the rural-urban line and limit the area in which development could take place (see here and here for details).
The Productivity Commission’s Final Report into housing affordability, released last year, was scathing of land-use planning in New Zealand, citing a body of evidence showing that strict policies of urban containment and slow development approval times had adversely affected the rate of new home construction and housing affordability in New Zealand.
In particular, the Productivity Commission’s Report noted that the land value of housing had risen significantly, particularly in Auckland, with land-use constraints a key driver of this escalation (see next chart).

Moreover, the Productivity Commission report showed that the cost of new housing blocks had escalated in real terms, particularly in Auckland:

And that the land price escalation has occurred at the same time as the number of sections sold has plummeted:

The release of the Demographia Survey on Monday appears to have brought New Zealand’s housing affordability problems into the limelight.
Yesterday, in response to the study, the New Zealand Prime Minister announced a reshuffle of Cabinet, assigning Nick Smith to housing in an attempt to improve affordability. The Government has also threatened to take planning control from local councils if they do not improve the supply situation, with the Auckland Council, in particular, in its sites.
For its part, the Auckland Council is holding firm to its Plan to tighten the city’s growth boundary, stating that it doesn’t “agree with the unplanned wholesale release of land which is going to cost the ratepayers a fortune to service”.
Meanwhile, the Opposition Labour Party has promissed to build 100,000 basic homes for first-home buyers, focusing on Auckland, over 10 years, in order to relieve the supply situation and improve affordability.
It looks like housing affordability is, once again, gearing up as a hot political issue in New Zealand.
This piece first appeared at Macro Business.
|


