NewGeography.com blogs

Adelaide Land Prices Top Sydney

The median price of serviced (improved) lots for new houses in Adelaide is reported to have risen above that of far larger Sydney by the Housing Industry Association of South Australia. Housing Industry Association of South Australian Executive Director Robert Harding attributed the high price of land to government policies that have limited the supply of land available for building. Nearly all thousands of square miles of land around Adelaide are off-limits to house building due to state government restrictions.

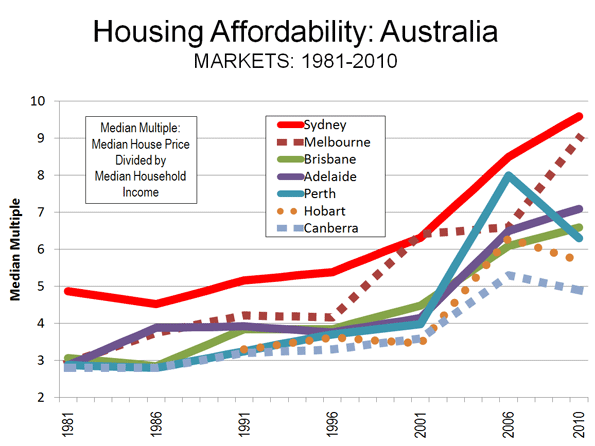
Adelaide is the slowest growing major metropolitan area of Australia, yet has some of the worst housing affordability among larger metropolitan markets. The 7th Annual Demographia Housing Affordability Survey found median priced Adelaide housing to be 7.1 times median household incomes, ranking the metropolitan area eighth most unaffordable out of 82 with more than 1,000,000 population.

Before the adoption of its strong smart growth (urban consolidation) land use restrictions, median house prices in Adelaide were one-half or less the present level (Figure). By comparison, new houses can be purchased in much of the United States for less than the median price of an empty lot in Adelaide ($180,000), though not in areas that have adopted smart growth restrictions.

Another Congressional Cut for High Speed Rail

July 15: Today there was another indication that the newly constituted House of Representatives understands the “litmus test” imperative of zeroing out high speed rail appropriations, in light of potentially required cuts in essential programs like Medicare, Social Security and others. $1 billion was switched to Midwest flood relief in an approval today of the Energy and Water Appropriations bill for the 2012 budget.

The bill may or may not pass the Senate and lobbying is underway to “obligate” the money before the rescission becomes law. Either way, this action and the previous action to reduce high speed rail funding by $2.5 billion in a previous budget deal with the White House indicates a very tough road ahead for the Administration’s high speed rail program, most of which is not genuine high speed rail.

The rescission would block funding that has been promised by the US Department of Transportation to a number of projects around the nation, such in California, North Carolina, Michigan, Missouri and Illinois.

Infographic: State Property Tax Data

Credit Sesame has created an interactive map showing property tax rates for all 50 states. Based on data from the Tax Foundation, the graphic also shows property tax rates as a share of home value and as a share of median income of homeowners. It's important to note that property taxes can vary regionally within states, and property taxes are only one part of overall state and local tax burden.


Mortgages – CreditSesame.com

Here's the Tax Foundation's numbers on overall state and local tax burden. For more on overall state business climates, check out our Enterprising States report.

Infographic: Which Industries Are Growing in Your State?

EMSI teamed up with Tableau Software to create this industry data display. You can visualize every broad-level (2-digit NAICS) industry by state over the last decade. Also, click on the dot for each state to see the trends for each sector. The bigger the dot, the more jobs that state has in the selected industry. It may take a few seconds to load.

A few observations:

1. Right off the bat, you can see the explosive growth of the mining sector nationally over the past few years. If you scroll to mining and oil exploration in the dropdown or isolate it by clicking on the chart, you can see Texas has by far the largest number of jobs among all states. We covered this sector and specific oil and gas extraction occupations in depth recently.

2. One of the cool things to do is scroll through each year to see the changing complexion of employment. There’s widespread growth projected for most states in 2011, with a few exceptions, but clicking back through the past few years shows a much different picture.

3. Another intriguing sector is manufacturing. In the last decade, it hasn’t fared well. That much is clear. But notice the tide start to shift in 2010, with Indiana and Michigan showing slight growth. And in 2011, nearly three-quarters of the US is expected to see job expansion.

More Hyperbole on Ghost Cities in China

The so-called Chinese "Ghost Cities" have been the subject of a number of articles in recent months. There appears to be some truth in the reports, such as in the building of a near empty new city in Inner Mongolia (Ordos). There is also a good deal of hyperbole.

A recent article ran in the Business Insider, entitled "New Satellite Pictures of China's Ghost Cities," which relied principally on satellite images, some quite old. Somewhat more proximate (as on-the-ground")  pictures are provided and linked in this article. They show that at least two of the Ghosts have risen from the dead (or they may never have been dead at all).

Changsha, Hunan: Changsha is the rapidly growing capital of Hunan province, adding nearly 50 percent to its urban districts between 2000 and 2010 (even greater growth than in the US growth leaders, Las Vegas and Raleigh). The Business Insider article displays a satellite image showing huge areas of construction both to the northeast and to the west of the urban area.

When planning a 2009 trip to China, I chose to visit Changsha because of the extensive construction shown in this very same satellite image. In my continuing satellite image research on urban areas, especially relating to  Demographia World Urban Areas, I noted that this appeared to be the most extensive construction in the nation. A number of photographs are included inour Changsha Rental Car Tour,  which were taken in September 2009.

On a rainy and quiet Sunday afternoon I took a tour of the northeast construction area and found that much of the construction had been finished. Moreover it was obvious from both the traffic and the open shopping centers and shops that this was anything but a "ghost city" (see photograph, above).

The next day I took a similar trip to the western construction area. As in the northeast, much of the construction was complete and the communities were alive.

Zhengzhou, Henan: Zhengzhou is also rapidly growing even faster than Changsha (over 60 percent in 10 years) and is the capital of Henan province. The article displays multiple satellite images of the Zhengzhou New Area. Because of a previous article in the Daily Mail, I took the opportunity on a recent trip to visit the Zhengzhou New Area and file a report. The Zhengzhou New Area is alive.

The Business Insider also indicates an unfamiliarity with Chinese geography.

Outside Jiangsu? A couple of the photographs referred to empty developments as being "outside Jiangsu," as a Westerner might describe a development as being outside Phoenix or Omaha. However Jiangsu is not an urban area or city, it is a province. Thus, to refer to a development as being outside Jiangsu is akin to referring to a development as being outside Arizona or Nebraska.

Changsha Already Twice as Large as Los Angeles? The Business Insider also advises us that Changsha is already twice as big as Los Angeles. In fact, there are no comparable geographies between Los Angeles and Changsha that could make such a statement even close to accurate. Regrettably, many writers and much of the press make comparisons between China and other nations without the remotest idea of the meaning of the geographical terms they are using. Here are a couple of ways that Los Angeles and Changsha can be compared.

1. Central municipality: The central municipality or core city of the Los Angeles area is the city of Los Angeles. It has a population of approximately 3.8 million people, but accounts for less than one third of the population of either the metropolitan area (functional area or labor market area) or the urban area (physical area or area of continuous development). Strictly speaking, there are no central municipalities in China, because the regions or prefectures are themselves municipalities. It is as if the city of Los Angeles comprised both Los Angeles and Orange counties. Chinese municipalities are divided into districts and if a comparison were to be made at the central municipality level, Changsha's central district would have to be used. This would be the district (qu) of Furong, which has a population of 500,000 people, about 1/8 that of the city of Los Angeles.

Core city comparisons are fraught with difficulties. This is illustrated by Melbourne, which had little more than 70,000 people in the last Australian census, approximately two percent of the metropolitan population. The 2010 US Census showed Melbourne, Florida to be larger.

2. Urban Area: The one level at which they valid comparison could be made is the urban area, or the area of continuous urban development. The latest data for Los Angeles (2000) indicates an urban area population of 11.7 million people. The 2010 US Census counts for the Los Angeles area suggest that the urban area total, once released will be little higher than the 2000 figure.

Based upon the 2010 census data, the next edition of Demographia World Urban Areas will estimate the Changsha urban area at approximately 3,000,000 people. Thus, by the urban area metric, Changsha has a population approximately one-quarter that of Los Angeles.

It is possible that Business Insider like others, compared the population of the central city of Los Angeles (3.8 million), which is only part of the urban area to that of the Changsha municipality (7 million), which has more than double the population of the Changsha urban area and covers at least 25 times as much land area (virtually all it rural). They are not the same thing.

-----

Photograph: In the northwestern Changsha "ghost city:" September 2009 (by author)