NewGeography.com blogs
I’ve spent a good chunk of the last few months working on a study of Calgary’s light rail transit (C-Train) system, which was released today by the Frontier Centre for Public Policy. I’ve had a long standing interest in LRT systems, and spent the summer of 2009 working for the Cascade Policy Institute in Oregon, where we compiled massive amounts of data on their world renowned LRT system as part of an ongoing project. The data (including actual field research, which proponents of the system haven’t done–they rely on survey data), indicates that ridership is lower, and costs are far higher than proponents believe.
That firsthand experience (which included riding the train every day), coupled with the empirical literature from light rail systems across North America, shattered my previous conviction that light rail transit can be an economical method of transit. For the record, I do believe that subways can be profitable in dense urban cores (even the badly managed TTC nearly breaks even), and buses already are profitable in many cases (especially inter-urban bus services, such as Greyhound and Megabus). Many proponents of LRT believe that it is a happy medium between subways and buses. If that were the case, it would be profitable. However, LRT combines the disadvantages of the two: it is slow, inflexible, and expensive. Numerous studies, in particular an authoritative study by the non-partisan United States Government Accountability Office, have demonstrated that on average, buses are a cheaper, faster, and more flexible than LRT for providing mass transit.
While I use many different metrics to demonstrate that the costs and benefits of LRT are wildly exaggerated, my favorite is that Calgary spends both the most on transit and the most on roads per-capita. Given that Calgary’s entire land use and transportation framework for the past several decades has been built around the C-Train, it is hard to call it anything but a failure. The City has cracked down on parking so aggressively to encourage people to ride the train that there are only 0.07 parking spaces per employee in the central business district. Because of this, Calgary is tied with New York for the highest parking prices on the continent. But many of those people who would otherwise have parked downtown instead park in the free parking spots provided at C-Train stations. Not only is free parking horribly inefficient, but this also emphasizes one of the major contradictions of the C-Train: it isn’t getting people out of their cars, and it isn’t helping to curb urban sprawl–two of its primary goals.
Unsurprisingly, those last two findings proved controversial, though not as controversial as my assertion that the C-Train fails to help the urban poor. A columnist for the Calgary Herald wrote an angry response to my Herald article that accompanied the story (though doesn’t seem to have read the study). She attempts to refute my arguments about urban sprawl, and the impact of the C-Train on the poor, while dismissing the study as “a cost-benefit analysis guaranteed to resonate with other right wingers who share the mantra of lower taxes above all else, including over the reality of everyday experience.” I’m not clear on when cost-benefit analysis became a right wing concept, but I’ll let that one go. I will, however, address her two criticisms in short order.
The idea that urban transit could worsen sprawl seems odd. The reason why it does so in Calgary is because the C-Train network is built on a hub and spoke model. What this means is that transit is concentrated on going from the outskirts, into the city center. Since LRT is so expensive, and since people need to be ‘collected’ by buses to get to LRT stations, the city has less resources to provide transit circling the core, or travelling east-west. And if you can’t provide good transit for people who aren’t living along LRT lines, and don’t work along one of the lines, people are just going to keep moving further out (hence the highest road costs in the nation). Here’s what Calgary Transit’s current planning manager has to say about the C-Train’s impact on sprawl:
“In one respect, it should allow Calgary to be a more compact city, but what it’s done is it’s actually allowed Calgary to continue to develop outward because it was so easy to get to the LRT and then get other places,” says Neil McKendrick, Calgary Transit’s current planning manager.”
While that comment is true for those who can afford to live by LRT stations (or to drive to them), it doesn’t apply to the city’s poorest. As it happens, LRT lines raise the cost of adjacent housing (though for proximate high end housing it lowers the value–hardly a concern for the poor)–by $1045 for every 100 feet closer to a rail station. This isn’t a terribly complicated concept. If you spend a massive amount of money on a form of transit that is considered to luxurious, the price of housing goes up. This is exacerbated by the fact that diverting transit resources to those areas makes transit there comparatively better, making it that much more desirable comparatively for people who intend to use transit at all–even as just an occasional amenity, say for going downtown on weekends. LRT is great for people who can afford to live by the stations, but not so much for anyone else.
Unfortunately, for many, light rail transit has become a sacred cow. But if Calgary is ever going to have adequate rapid transit, the City will need to explore more cost effective options. Buses may not be trendy, but expanding BRT in Calgary would dramatically improve people’s mobility at a reasonable cost. Fortunately, the current Mayor has acknowledged that BRT will have to be part of the solution for making Calgary a transit friendly city. He also made the wise decision of de-prioritizing the southeast LRT extension (expected to cost $1.2-$1.8 billion). If the Mayor follows up on his promise to make BRT an integral part of Calgary Transit in the short term, the City will not only have far better transit, but it will have a chance to watch the LRT and BRT operating side by side so that the people can decide for themselves whether the billion plus required to build the Southeast LRT is worthwhile. My bet is on BRT.
This piece originally appeared at stevelafleur.com
Zhengzhou, Henan, China (March 28, 2011): In December, London’s Daily Mail reported that the Zhengzhou New Area was China’s largest “Ghost City.” A visit to the Zhengzhou New Area indicates exactly the opposite. Chinese “Ghost Cities” are large areas of new development that are virtually unoccupied. The most famous example is Ordos, a new and reportedly empty city, built to replace an older city in Inner Mongolia.
Zhenghou is an urban area of approximately 2.5 million population and is the capital of Henan province. The Zhengzhou New Area is located in the northeastern quadrant of Zhengzhou. It is circular in design, with two parallel roads, high-rise condominium buildings on the inner ring and commercial buildings on the outer ring. The interior of the circle includes the Henan Arts Center and a skyscraper that is under construction. A new high speed rail station is under construction to serve the new Guangzhou to Beijing line. The station is to be one of the largest in Asia.
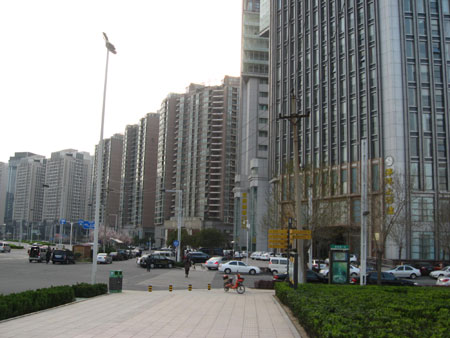
Our visit revealed anything but a Ghost City. Granted, no-one would mistake the traffic for Beijing Third Ring Road volumes, but virtually all of the parking spaces were taken and there was traffic on the streets (Figure 1). That ultimate indicator of Chinese urbanization, the availability of frequent taxicab service was well in evidence. Two of the city’s bus rapid transit lines serve the interior circle road, again indicating a substantial threshold of non-ghost urbanization.
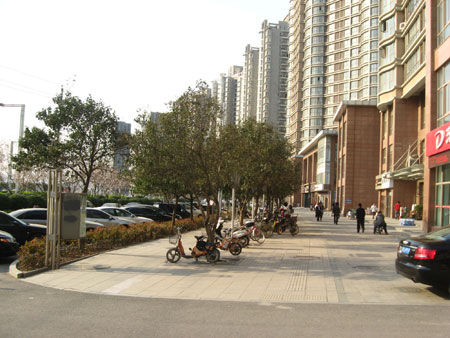
There were people on the sidewalks, though not the numbers typical of an older, more dense section of a Chinese urban area (Figure 2). It was clear from the laundry hanging in glass enclosed patios that many of the condominiums were occupied, though it is to be expected that many would not be, given the Chinese propensity to invest in multiple residential properties (a tendency the central government seeks to curb). Many of the commercial skyscrapers were occupied, and some were still under construction. There are also shopping centers, small stores and fast food restaurants.
Zhengzhou New Area is intended by the developers to become the new central business district for Zhengzhou. There is much more planned than this first phase. Eventually, the Zhengzhou New Area is intended to cover 105 square kilometers (41 square miles), generally further to the northeast. City maps already show the planned street pattern, not unlike 19th century maps of some US cities.
In short, the Zhengzhou New Area is alive and not a Ghost City. It may well be that it took longer than expected for the place to come alive. But it is clear that the life of the Zhengzhou New Area began more than four months ago.
The Vancouver Olympic Village scandal continues to worsen. During construction, the City of Vancouver was forced to take over financing of the project, as the developer’s initial lender backed out due to cost overruns. At the end of last August, the developer fell behind its payment schedule, and the City placed the property into receivership in November. The development has been a spectacular failure, with fewer than half of the 737 units being sold. The outstanding debt to the city is $743 million. To make things worse, a quarter of the tenants are now suing the City.
One might expect that a billion dollar development for Olympic athletes would be pretty posh. Prices ranged from $530,900 for a 566 square foot studio, to $4.8 million for three bedroom units. Even in unaffordable Vancouver, you’d expect that to come with a bedroom big enough to fit a bed. According to tenants, they didn’t even get that. What they did get was bizarre leaks, cracking ceilings, and inadequate heating. The project sounds like something out of Arrested Development, or as the tenants’ legal counsel put it, “It’s like they were sold a BMW and they got a broken Toyota. And even if they manage to fix everything, it’s still a Toyota.” The units are far from the luxury accommodations buyers were lead to believe they were getting.
In short, the lawsuits seem perfectly legitimate, and are likely to cost the City another $50 million dollars. It’s also hard to imagine this quagmire will help the value of the units on the market. Even before the horrendous conditions of the condo units were made public, reports claimed that the development was worth $150-200 million less than what was owed to the city. It is hard to imagine a scenario where the city isn’t stuck with hundreds of millions of dollars of losses.
Of course, none of this should come as a surprise. Government housing projects generally fail. And if governments can’t build adequate housing for the poor, it’s hard to imagine them building upscale housing at a price that the market will bear. Hence the shoddy work. The lesson here is a simple one, that history proves again and again: governments make bad landlords.
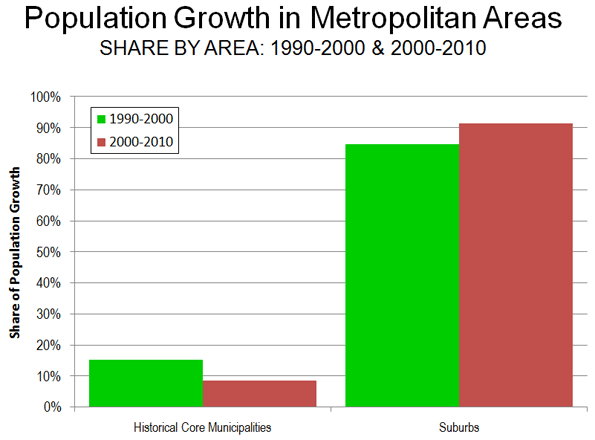
Based upon complete census counts for 2010, historical core municipalities of the nation’s major metropolitan areas (over 1,000,000 population) captured a smaller share of growth in the 2000s than in the 1990s.
The results for the 50 metropolitan areas (New Orleans excluded due to Hurricane Katrina and Tucson unexpectedly failed to reach 1,000,000 population) indicate that historical core municipalities accounted for 9 percent of metropolitan area growth between 2000 and 2010, compared to 15 percent in the 1990-2000 period. Overall, suburban areas captured 91 percent of metropolitan area population growth between 2000 and 2010, compared to 85 percent between 1990 and 2000.
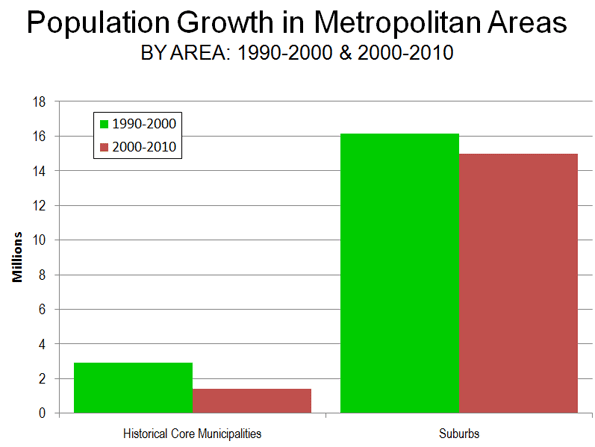
Total population growth in the historical core municipalities was 1.4 million, nearly all of it in municipalities with a largely suburban form (such as Phoenix, San Antonio and Charlotte). This compares to an increase of 2.9 million during the 1990s.
Suburban areas (areas in metropolitan areas outside the historical core municipalities) grew 15.0 million, down from 16.1million.
Overall, the major metropolitan areas added 14 percent to their populations in the 2000s, down from 19 percent growth in the 1990s. The historical core municipalities grew 4 percent, compared to the 1990s rate of 7 percent. Suburban areas grew 18 percent, compared to the 1990s rate of 26 percent (all data unweighted).
There are only 9 cities in the United States with populations over 1 million. The list includes New York, Los Angeles, San Diego, Philadelphia, Chicago, Phoenix, Houston, San Antonio, and Dallas. With this afternoon’s release of Census 2010 numbers for New York City, the final 2010 data is in.
Of these 1 million or more cities, only Chicago lost population over the last decade, yet the media seems to be in love with Mayor Daley. The New Yorker called Mayor Daley “America’s most successful mayor.” Newsweek is equally “impressed” with Daley’s performance, saying “Daley also leaves behind a glittering metropolis that Chicagoans rightly love and outsiders can only envy.”
Chicago’s 200,000 person loss shows Mayor Daley’s failed legacy as Mayor. Daley leaves office with a smaller population than when he took office in 1989. Numbers are stubborn things. There was no Chicago comeback of the middle class to experience bad public schools, high taxes, and corruption. Almost no one predicted Philadelphia would gain population while Chicago declined. Mayor Daley’s legacy appears to be built on smoke and mirrors. A fawning media of urban reporters puffed up Daley for years. According to the numbers, Mayor Daley is America’s worst Mayor leaving Rahm Emanuel with intractable problems. Is it more accurate to call Mayor Daley the white man’s Coleman Young?
Just released census counts for 2010 show the New York metropolitan area historical core municipality, the city of New York, to have gained in population from 8,009,000 in 2000 to 8,175,000 in 2010, an increase of 2.1 percent. This is the highest census count ever achieved by the city of New York.
Nonetheless, the figure was 245,000 below the expected level of 8,420,000 (based upon 2010 Census Bureau estimates). The higher population estimate had been the result of challenges by the city to Census Bureau intercensal estimates. The city of New York attracted 29 percent of the metropolitan area growth. Approximately 43 percent of the metropolitan area’s population lives in the city.
Overall, the New York metropolitan area grew from 18,323,000 to 18,890,000, an increase of 3.1 percent. The suburbs grew approximately twice as rapidly as the city of New York, at 4.0 percent, and attracted 71 percent of the metropolitan area growth.
According to US Census Bureau data, the Charlotte (NC-SC) metropolitan area grew 32 percent, from 1,330,000 to 1,758,000 between 2000 and 2010. The historical core municipality, the city of Charlotte grew from a 2000 base of 568,000 to 731,000 in 2010 (an increase of 29 percent). The city of Charlotte is largely of a post-World War II suburban form. The city of Charlotte attracted 38 percent of the metropolitan area growth.
The suburbs grew at a 35 percent rate, higher than that of the city of Charlotte. The suburbs captured 62 percent of the metropolitan area growth.
The Providence (RI) metropolitan area was one of the slowest growing in the 2000 to 2010 period, according to counts just released by the Census Bureau. Providence grew 1.1 percent, from 1,583,000 to 1,601,000. The historical core municipality, the city of Providence gained 2.5 percent, from 174,000 to 178,000 and grew faster than the suburbs, like neighboring Boston. The city of Providence reached its population peak in 1940, at 254,000.
Even so, the suburbs attracted 75 percent of the metropolitan area growth.
What defines the American Dream? A new poll by Big Builder reveals that one answer to this enduring question may be home ownership. A major portion of the American population (59%) believes that they are living the American Dream. Respondents distinguished owning a home as the second most important factor of the American Dream, just behind raising a family.
Another statistic in this poll seem to suggest that this trend may be more stifled as the younger generation of Americans (18-29 year olds) come to the crucial decision of buying a home. Still, 49% see home ownership as a “sound investment,” while 49% of this age group call it “too risky.” Perhaps the effect of the weak economy has been especially evident in this age group.
Some interesting contradictions also arise in these statistics. For instance, 58% of those who believe the housing crisis is a chronic problem also recommend buying a home. Furthermore, 75% of respondents claim to not have benefited from any federal program to assist in ownership (such as mortgage interest deduction), yet 71% confessed to taking the deduction. The pollsters have considered that perhaps the government’s assistance in home ownership may be unclear for many Americans.
A final statistic worth mentioning is that 58% of Americans believe that fulfilling the American Dream is influenced mostly by their own skills and hard work than by the current state of the economy. The ubiquitous American Dream still runs on hard work and the pressing notion of owning a home, it would seem.
The historical core municipality of the Detroit metropolitan area, the city of Detroit, continued its steep population decline between 2000 and 2010. The new census count indicates that the city dropped to 733,000 residents, from 951,000 in 2000. This drop of 25 percent was the largest in any census period since 1950, when the city peaked at a population of 1,850,000. Even so, the percentage decline from 1950 of 61.4 percent remains less than that of city of St. Louis, which has experienced the steepest population decline of any municipality that has reached 500,000 population in modern times (62.7 percent).
The decline did not extend to the suburbs, which gained a modest 2.3 percent between 2000 and 2010. Suburban growth has also been substantial since 1950, with 2.2 million new residents added.
However, the suburban growth was not enough to erase the impact of the city of Detroit decline. The Detroit metropolitan area fell from 4,452,000 in 2000 to 4,296,000 in 2010, a loss of 3.6 percent. The loss was the greatest among major metropolitan areas reporting up to this time. Nonetheless, even with the huge city of Detroit loss, the Detroit metropolitan area has grown more than 30 percent and more than 1,000,000 people.
|


