NewGeography.com blogs

Driving for Popsicles: Kidnapping Hysteria in America

Not long ago, I saw an urban planner speak about the “Popsicle test” as a barometer for healthy urban design: in an ideal community, a child is able to safely walk a short distance from their home to buy a Popsicle. In such a community, kids have the freedom and independence to enjoy a carefree childhood walk without having to worry about traffic or neighborhood bullies.

But increasingly, allowing a child to walk those few blocks for his beloved Klondike bar is looked at as a gross act of parental negligence and child abandonment. As this NY Times article attests, allowing an unsupervised or unaccompanied stroll from school in many communities will earn you the admonishment of school administrators, the police, and of course, fellow parents. One Columbus, Ohio parent allowed her 10 year-old son to walk the mile back from school prompting several 911 calls by concerned drivers upon seeing the child walking alone. A police officer drove him home and reprimanded the parents. And it was an unusual sight: only 13% of children walked or biked to school in 2001 compared to 41% in 1969.

Overparenting run amok? Every time a stomach-churning story about a Jaycee Dugard breaks, it dominates the news for a good week. Coupled with the innumerable fictional depictions of kidnapping on television shows and it’s no wonder that American parents expect to see a dirty van with tinted windows on every suburban street.

Yet, an examination of missing children statistics shows that the fear of kidnapping is rather disproportionate to the actual threat. Looking at the data from the California Dept. of Justice, for example, there were 114,000 missing children reports filed in the state last year (for comparison’s sake there were nearly 37,000 missing adults claims). Of this number, 108,000 or 95%, were runaways. There were 35 documented Dugard-type stranger abductions compared to 1,363 parental or family abductions. That is to say, in documented cases, a child is almost 40 times more likely to be swept away by a disgruntled parent wronged in a divorce settlement than a Philip Garrido whack-job. But when a child is missing, in 19 of 20 cases they have run away.

But such nuances of the data are lost on sites like the National Amber Alert Registry which announces, on its "statistics page" complete with a clock ticker, that 800,000 children go missing every year – one every 40 seconds. A more accurate ticker would say, “a child goes missing every 40 seconds, but most are runaways that end up returning home.”

It goes without saying that the value of parental diligence and responsibility should never be discounted and that the nightmare of child abduction does exist, but the fear of it has grown in recent years to a such level of hysteria that some of the pleasures and autonomy of childhood have been removed. Groups like Safe Routes to School are concerned by the decrease in the number of children walking and biking to school and are working on increasing the number of safe commuting routes for kids.

But as long as the fear of the "Popsicle walk" is pervasive, it appears that kids will be nagging their parents for a "Popsicle drive" for a long time to come.
Recession Job Losses and Recovery in Midwest Cities

The Windy Citizen pointed me at coverage of metro area job losses in the recession. Here is how the 12 cities I principally cover in this blog stacked up, sorted in descending order of percentage losses:

  1. Detroit; 139,600 jobs; -7.5%
  2. Milwaukee; 44,800; -5.2%
  3. Cleveland; 54,100; -5.1%
  4. Chicago; 206,200; -4.5%
  5. Indianapolis; 40,200; -4.4%
  6. Cincinnati; 42,200; -4.0%
  7. Louisville; 22,900; -3.7%
  8. Minneapolis-St. Paul; 63,100; -3.5%
  9. St. Louis; 43,900; -3.3%
  10. Pittsburgh; 32,800 - 2.8%
  11. Kansas City; 21,900; -2.1%
  12. Columbus, Ohio; 19,600; -2.1%

A couple things that jump out of me from this are that Chicago and Indianapolis are doing far worse than conventional wisdom views of their overall economic health. Both regions are getting clobbered. The Pittsburgh story gets some additional ammunition, as does my view that Columbus is the next Midwestern star.

Recession Job Recovery

So when will the jobs come back? Nobody knows for sure, but an organization called IHS Global Insight has predicted the year in which employment will match its pre-recession peak in various major US cities (via IBJ News Talk):

  • Kansas City: 2011
  • Columbus: 2012
  • Indianapolis: 2012
  • Louisville: 2013
  • Minneapolis-St. Paul: 2013
  • Pittsburgh: 2013
  • Chicago: 2014
  • Cincinnati: 2014
  • St. Louis: 2014
  • Cleveland: After 2015
  • Detroit: After 2015
  • Milwaukee: After 2015

Visit Aaron's blog at The Urbanophile.

American Hobbit Houses

Soon after President Obama took office, a proposed plan to “develop federal policies to induce states and local communities to embrace ‘smart growth’ land use strategies” was announced.

This “Livable Communities Program” is intended to save land and clean up the environment. It is seen as encouraging denser housing arrangements to deter automobile use and accommodate the transit industry, according to goals set by the Secretaries of HUD, EPA and Transportation.

One potential downside to this plan comes from the transit industry’s Moving Cooler study, which argues that the Administration’s greenhouse gas reduction proposals “may result in higher housing prices, and some people might need to live in smaller homes or smaller lots than they would prefer.”

If you want to see how this might work, look at the U.K., which imposed strict land regulations in the Town and Country Planning Act in 1947. This effectively froze the supply of land for a growing population, leading to soaring house prices, particularly in the area around London.

With the land available for development frozen, house size decreased as well, leading to new British homes garnering the nickname of “Hobbit houses.” New British homes are a little more than a third as big as new U.S. homes (818 sq. feet compared the U.S.’s 2,303 sq. feet).

The question is whether or not the Federal government should be granted the ability to limit housing standards. Currently, this responsibility lands in the lap of state and local governments.

Can President Obama afford to add the President of the (Hobbit) Homeowner’s Association of the United States to his title?

Subjects:

Don't Go Looking for Work in California

The current economic recession has tarnished the Golden State’s employment opportunities in a major way.

A report released on Sunday by the California Budget Project says that two of five working-age Californians do not have a job.

The level of unemployment has not been this high since February 1977. In fact, the study found that “California now has the same amount of jobs as it did nine years ago.” The only difference? In 2000, the state was home to 3.3 million fewer working age people than today.

The nation is not faring much better, as the U.S. Labor Department reported last Friday that the nation’s jobless rate had climbed to 9.7 percent, the highest since 1983. California’s unemployment stands at over 11 percent.

New Job Market Report from Jobbait Adds New Data

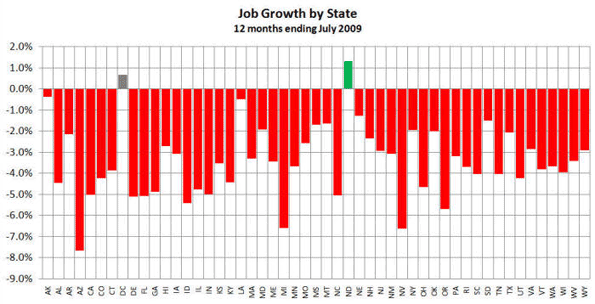
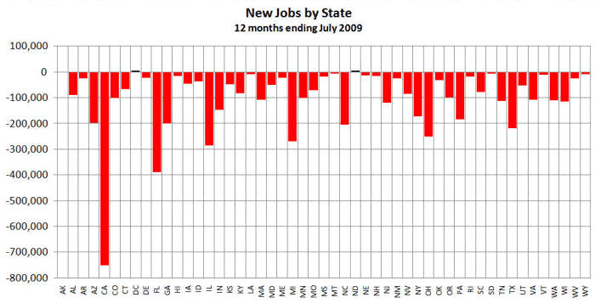
Mark Hovind over at Jobbait.com released his monthly job market report, and this month he's expanded it significantly with sector-level data by state and metropolitan area.

Mark offers the numbers in an easily digestible format organized by state in color coded tables. It's a great way to get a feel for what's happening in your region or nationally.

Mark hopes this will help identify sectors with job prospects, even in regions where overall employment is declining.

Looking at total job growth, North Dakota is still the only state showing year-over-year employment growth, followed by Washington, DC.

Fastest declining states by growth rate are Arizona, Michigan, Nevada and Oregon.

Fastest declining states by sheer numbers are California, Florida, Illinois, Michigan, Ohio and Texas.

See Jobbait.com for the full report.