The Tax Foundation calculates the taxes paid per capita, including what is spent by people on average in neighboring states, including state and local fees. The two maps show, first, the tax burden, taxes paid as a percent of income, the second, the difference in the ranks of states in tax burden and in income.
The map for tax burden is colorful, so one might suppose there is a big difference in the local and state burden. There is variation, but the amazing story is how small the differences really are. The variation is from a maximum of 11.8 percent in New Jersey (note that Taxachusetts is in the middle of the pack) to a low of 6.4 percent in Alaska. But most states, 38, are in between 8.6 and 10.2 percent.
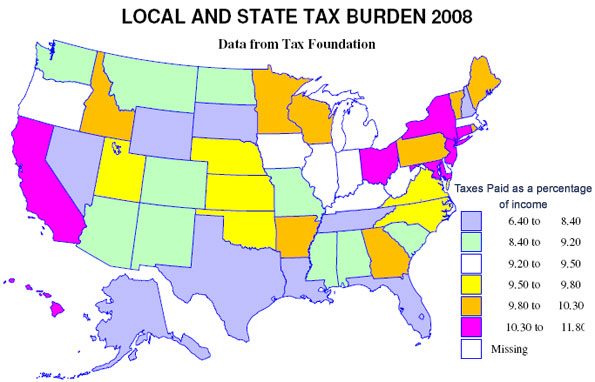
The lowest tax burdens are not surprising – Alaska (6.4) and Nevada (6.6), but the next lowest, Wyoming (7) and Florida (7.4), may be a surprise. The highest tax burdens, as may be expected, are megalapolitan New Jersey, New York (11.7), Connecticut (11.1) and Maryland (10.8), but Hawaii (10.6) in this group may be a surprise. The states in the middle, besides Massachusetts, include a contiguous set centered in Chicago – Illinois, Indiana, Iowa, Michigan, Kentucky and West Virginia (all 9.3 to 9.5).
The modest range of burdens implies that generally richer states have higher tax burdens and poorer states have lower burdens, but the second map shows that there are many exceptions. Richer states with higher tax burdens include (a small difference in tax and income ranks) District of Columbia, New Jersey, Connecticut, New York and Maryland, and poorer states with a moderately low tax burden are few – Alabama, New Mexico and Montana. Poorer states but with a high tax burden are Arkansas, Kentucky, Utah and Idaho, but this finding perhaps tells us the statistical problem or risk in using per capita rather than per household measures. Strongly Mormon Utah and Idaho, indeed all four states have high average household size, so are not as disadvantaged as the data suggest. For a similar reason, Florida may not be as good as it looks, since it has a quite low average household size.
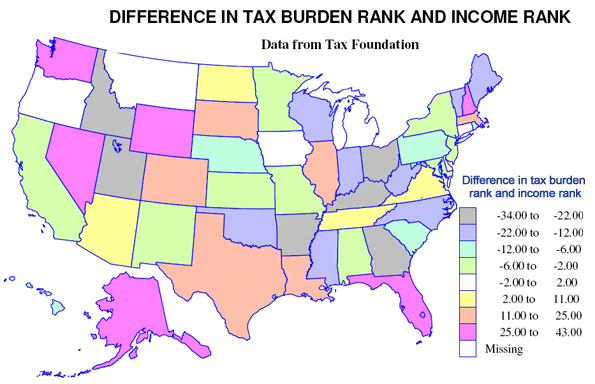
Most interesting may be the richer states with lower ranking tax burdens, notably Wyoming, New Hampshire, Washington and Nevada. Other states with a relatively low burden (lower tax rank than income rank) include Alaska, Colorado, Florida, Massachusetts, and Texas and other states with a relatively high burden (much higher tax rank than income rank) include Georgia, Kentucky, Ohio and West Virginia.
Finally states with close to the same rank in income and tax burden include a set of contiguous Midwestern states, Iowa, Minnesota, Missouri, and Kansas, then Michigan, Oregon and California.
But in sum, choosing a state based on its local and state tax burden could be worth the effort, but the effects by themselves could be more limited than commonly supposed.