NewGeography.com blogs
Shortly after I told you that Bloomberg.com is reporting a running total of the money the U.S. government has pledged and spent for bailouts and economic stimulus, reporters Mark Pittman and Bob Ivry updated the totals: So far, $12.8 trillion has been pledged – an additional $1.2 trillion over the earlier report. The total disbursed through March 31, 2009 stands at $4.2 trillion. The Federal Reserve is still committed to providing the largest share at $7.8 trillion, followed by the U.S. Treasury $2.7 trillion and FDIC $2.0 trillion.
The national debt currently stands at $11.3 trillion — versus an authorized limit of $12.1 trillion. Spending, lending and bailouts by the Federal Reserve are not counted toward the limit.
This week, U.S. Treasury Secretary Timothy Geithner is in China. Mainland China holds $767.9 billion of Treasury securities at the end of March 2009 or about 7 percent of the total national debt. Japan, the second largest major foreign holder, has $686.7 billion.
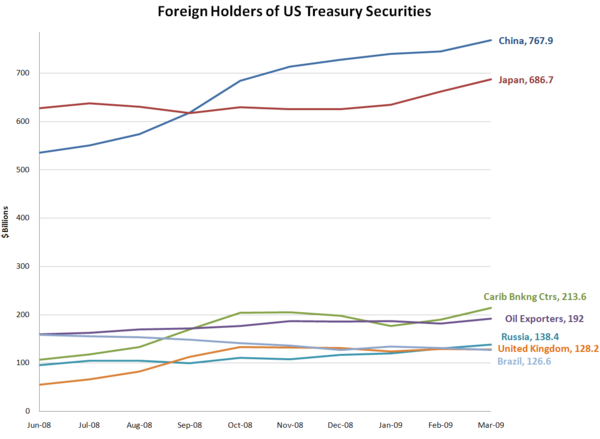
Notes: Data from Department of the Treasury. Caribbean Banking Centers (Carib Bnkng Ctrs) include Bahamas, Bermuda, Cayman Islands, Netherlands Antilles, Panama, and British Virgin Islands. Oil exporters include Ecuador, Venezuela, Indonesia, Bahrain, Iran, Iraq, Kuwait, Oman, Qatar, Saudi Arabia, the United Arab Emirates, Algeria, Gabon, Libya, and Nigeria.
The U.S. bailout commitment of $11.6 trillion equals 89 percent of U.S. 2008 gross domestic product (GDP).
Jonathan Weber writes that "Most demographic and market indicators suggest that growth and development across the country are moving away from the suburban and exurban fringe and toward center-cities and close-in suburbs," in an article for MSNBC entitled Demographic trends now favor downtown: Growth across the country moves away from suburban and exurban fringe.
One might wonder what country Weber is writing about. In the United States, growth and development continues to be concentrated in suburban and exurban areas. Moreover, strong domestic migration continues away from the center cities and close-in suburbs, as evidenced by the fact that between 2000 and 2008, 4.6 million domestic migrants left the core counties of the metropolitan areas over 1,000,000 population, while 2.0 million moved into the suburban counties.
The case is apparently furthered by the obligatory reference and photograph of The Model, Portland, Oregon. However, even in Portland, the suburbs are doing far better than the core. Since 2000, the suburbs have gained 106,000 domestic migrants, while the core county (Multnomah) has lost 4,000 domestic migrants. The IRS micro-data further indicates that the core continues to lose net domestic migration to the suburban counties.
It appears that the only trend indicating that the suburbs are losing out to central cities is the exponential increase in articles blindly parroting “death of the suburbs” dogma.
More than once in this space, I’ve said that derivative financial products set up a perverse incentive where investors have more to gain from the failure of companies and homeowners than their success. If you haven’t seen it yet, take a look at the longer version of my description of the causes and consequences of the current crisis to understand how failed financial innovations, like credit default swaps, contributed to the meltdown of 2008. I wrote that article back in November.
Once again, only Bloomberg.com is out front on this story. More hedge funds are catching onto the casino-like qualities of betting against America’s economic success. Reporters Salas, Harrington and Paulden could have quoted my NewGeography writings directly: “companies [have] more credit-default swaps outstanding than the bonds the contracts protected…” and, referring to Clear Channel Communications, “some of its creditors stand to profit from its failure.”
Told ya’ so!
Political “spin” descended to a new low today with the publication of survey results purporting to suggest that suburban residents and workers are pining for city life. The Washington Business Journal dutifully reported that Today’s suburban workers and residents miss the amenities of cities. The survey sponsor, the Fairfax County (Virginia) Economic Development Authority noted that “almost half of workers who work in the suburbs, say they want more public transportation, more housing options, greater access to useable green space or a better variety of job opportunities – typical features of cities.”
All of this may sound impressive until you realize that no one urban “amenity” was mentioned by more than 25 percent of respondents. That means, for example, that 77 percent of responding suburban residents did not consider “access to convenient public transportation” important enough to mention, while 23 percent did.
According to the Economic Development Authority, the survey indicates that 52 percent of residents “say they would move to a community that offered more of these” urban amenities.
The survey got the moving part right, but missed by a mile on where they are moving. From 2000 to 2008, more than 100,000 domestic migrants left Fairfax County, 11 percent of its 2000 population. But they didn’t move to the city (Washington) or to more urban Alexandria or Arlington, because all of these lost domestic migrants as well. Indeed, the only counties in the Washington, DC area that gained domestic migrants are further from the city than Fairfax County.
It has become customary for the fawning print media to lazily repeat whatever information is provided them by the urbanist lobby. The result is all manner of puff pieces that report as reality what is nothing more than hopes, or even delusions.
The latest puff piece is about Portland and is in today’s Wall Street Journal. The article indicates that 8 percent of Portlanders commute to work by bicycle, based upon data from a bicycle advocacy group. That number is more than five times the figure reported by the United States Bureau of the Census, (which is not a bicycle advocacy group). In 2007 (latest data available), 1.5 percent of Portland metropolitan area workers commuted by bicycle according to the Bureau of the Census.
It is, of course, possible that there is confusion about the definition of Portland. Domestic migration is the principal subject and it is clear from the data cited that the article is citing metropolitan area data, rather than municipal (city of Portland) data.
However, even if we allow that the editors might have erroneously substituted municipal for metropolitan data and that the advocacy group bicycle market share of 8 percent applies to the city of Portland; it would still be off by at least 100 percent. The Bureau of the Census data indicates that 3.9 of workers rode bicycles to work in 2007 in the city of Portland.
Of course, it is always possible that three quarters of metropolitan Portland’s bicycle commuters have fallen off their bikes or that, if the editors were confused as to the difference between metropolitan and municipal, that half have fallen off.
|


