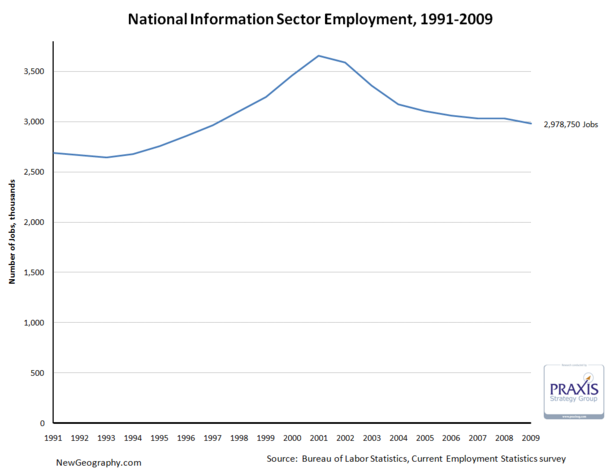
Between economic development strategies targeting software firms, the deflation of the tech bubble, talk of "broadband," and recent consternation about failing publishing business models, we seem to hear a lot about the information sector. Recognizing that, it's interesting that the information sector only comprises about 2.2% of total employment in the US.
On top of that, after a big decline since the tech bubble peak in 2001, in February the sector has receded to just more than 2.9 million jobs, a level not seen since April 1996.
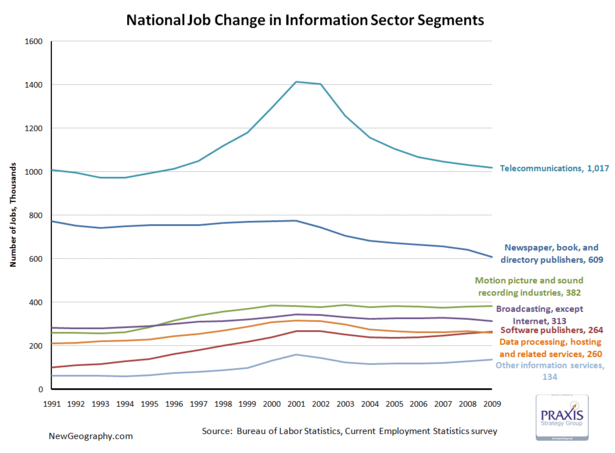
The telecommunications subsector accounts for just more than 1/3 of information employment, and saw the biggest boom and bust. Publishing has declined since 2000, and motion picture and sound recording industries are larger than either software publishing or data processing.
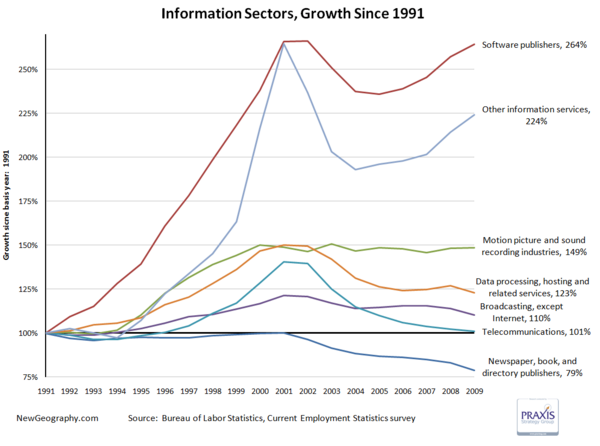
Looking at percent change, software has recovered from the tech bust, while the movie business has remained steady since topping off in 2000. Worse off are telecom and data processing, which continue the post bust slide.
One fifth of the jobs in the publishing industry have vanished since 2001.
This is not to say technology occupations are not a key part of the nation's economy and productivity gains over the past decade, but the importance of the information sector itself is overstated. High-tech industries that produce products generally fall into manufacturing sectors while things like systems design, web design, or even custom programming are business services.
The next post will look at regional shifts in information employment, but until then check out Ross Devol's more comprehensive study on regional tech poles.
Other Information services includes: news syndicates, libraries, archives, exclusive Internet publishing and/or broadcasting, and Web Search Portals.