
While traffic congestion plagues many cities, Los Angeles stands apart. The Texas Transportation Institute tracks congestion statistics for U.S. metropolitan areas on an annual basis, and Los Angeles routinely ranks first for both total and per-capita congestion delays. Considering the value of wasted time and fuel, TTI estimates the annual cost of traffic congestion in greater Los Angeles at close to $10 billion.
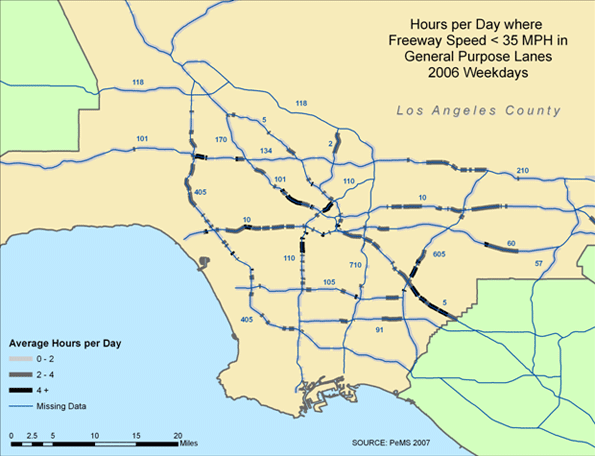
The map in Figure 1, based on 2006 Caltrans sensor data, illustrates the weekday pattern of traffic congestion on the LA freeway network. Congestion is pervasive throughout much of the county; most freeways have segments on which traffic averages less than 35 mph at least two hours per day, and many bottlenecks are congested at least four hours per day.
Figure 1. Traffic Conditions on the LA Freeway Network
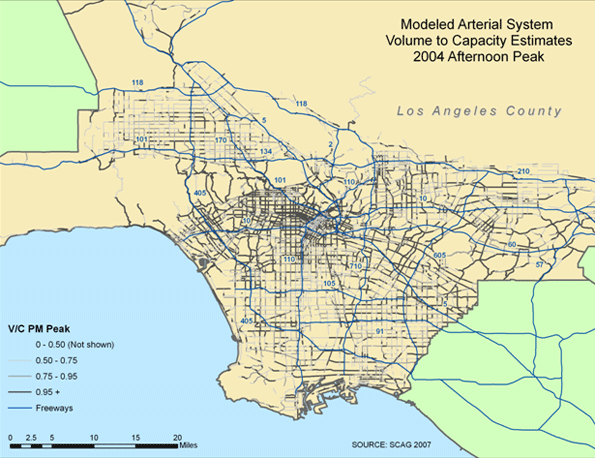
Conditions on the surface streets are not much better. The map in Figure 2, based on 2004 volume-to-capacity (V/C) estimates from SCAG, depicts the pattern of afternoon traffic congestion on the county’s largest arterials. Here again it is evident that traffic congestion is broadly dispersed, yet the pattern is particularly intense between downtown Los Angeles and the Westside.
Figure 2. Traffic Conditions on LA Surface Streets
With the recent run-up in fuel prices followed by a severe recession, total travel in Los Angeles has declined over the past two years, and congestion has correspondingly eased. Yet if past trends hold, this reprieve is likely to be fleeting. Should the region’s economy and population grow in the coming decades, as some forecasts predict, the probable outcome is even more vehicle travel and in turn more intense congestion.
Controversial Solutions for a Daunting Problem
Researchers at the RAND Corporation were asked to recommend strategies capable of reducing LA traffic within five years or less (the short timeframe rules out land-use reforms along with major infrastructure investments). The resulting report, Moving Los Angeles: Short-Term Policy Options for Improving Transportation, offers recommendations at once controversial and likely inescapable. To achieve lasting traffic relief, it will be necessary to manage the demand for travel through pricing reforms (e.g., congestion tolls) that increase the cost of driving and parking in the busiest corridors and areas during peak travel hours. Other measures—better transit service, ridesharing programs, traffic signal synchronization, and the like—can complement pricing, but are not on their own sufficient to stem current and projected future traffic congestion.
Few Strategies Offer Much Promise
Just why should this be so? Consider, first, that traffic congestion results from an imbalance between the supply of roads and peak-hour automotive travel. In fact, congestion can be viewed as a solution (though an unpleasant one) to this imbalance; when demand exceeds supply, congestion makes us wait our turn for available road space to balance the equation. Over the past several decades, the gap between supply and demand has widened considerably; population growth, economic expansion, and rising incomes have fueled the demand for more vehicle travel, while road construction has stagnated. We have therefore been relying, more and more, on congestion to resolve this imbalance.
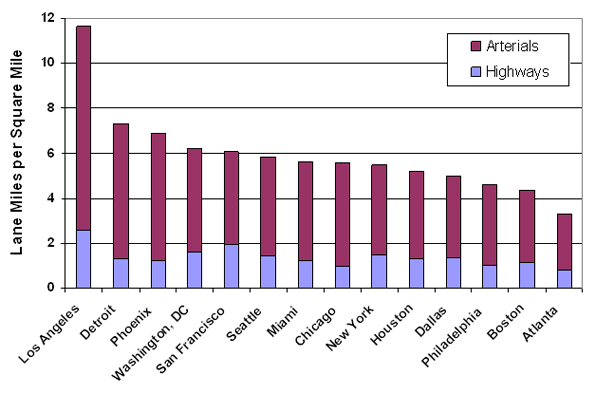
One response would be to build or expand more roads to accommodate additional vehicle travel. Setting aside policy concerns related to greenhouse gas emissions and energy security, the prospects for “building our way out of congestion” are limited. To begin with, there simply isn’t much space to build new roads in Los Angeles, particularly in the most densely developed urban areas. As shown in Figure 3, the density of the road network in the greater Los Angeles region, measured in lane miles per square mile, is already far greater than in any other large metropolitan area in the country.
Figure 3. Road Network Density in Major Metropolitan Areas
We also lack the resources to engage in an extensive road building spree. In recent decades, federal and state elected officials have failed to increase fuel taxes enough to offset the effects of inflation and improved fuel economy, thus hobbling the major source of funding for road construction and repairs.
Even if we could expand the road network, though, the benefits would be limited by a phenomenon described as “triple convergence.” Congestion has been a problem for years, and many individuals deliberately alter their travel patterns to avoid severe traffic. When an investment in road capacity reduces peak-hour congestion, many will conclude that they no longer need to go out of their way to avoid congestion delays and will thus “converge” on the improvement from (a) other times, (b) other routes, or (c) other modes of travel. The net effect is that the initial traffic-reduction benefits will usually not last over time. This is why we often see, for instance, that the improved traffic flow resulting from a new freeway lane does not last for more than a couple of years.
If supply-side remedies do not create sustainable reductions in traffic, it becomes necessary to examine ways of reducing peak-hour travel demand. Commonly employed options include improved transit service, voluntary ridesharing programs, flexible work hours, and telecommuting. Unfortunately, the congestion-reduction benefits of these strategies are likewise undermined by triple convergence. If a new subway line induces some peak-hour drivers to switch to transit, other drivers will soon converge on more freely flowing roads to take their place. Indeed, the effects of triple convergence explain why traffic congestion has grown steadily worse despite considerable state and local investment in a broad range of congestion-reduction strategies.
Only Pricing Strategies Promise Sustainable Reductions in Traffic Congestion
This brings us to the rationale for pricing strategies. Among the many possible options for reducing traffic congestion, only pricing resist the effects of triple convergence. By increasing the cost of driving or parking in the busiest areas or corridors during the busiest times of day, pricing measures manage the demand for peak-hour travel, in turn reducing congestion. Once traffic flow improves, the prices remain in place, thus deterring excessive convergence on the newly freed capacity.
Pricing strategies offer two additional benefits. First, pricing generates revenue to support needed transportation investments. And in comparison to sales taxes, a common option for raising local transportation revenue, pricing has been shown to reduce the relative tax burden on lower income groups (though wealthier individuals consume more taxable goods than their less-affluent counterparts, to an even greater extent they (a) drive more, (b) are more likely to travel during peak hours, and (c) are more likely to pay peak-hour tolls rather than alter their travel choices). Second, pricing enables more efficient use of the road capacity that we already have, because roads on which traffic flows smoothly (at roughly 40 mph or higher) can carry far more vehicles per lane per hour than roads snarled in stop-and-go congestion. Paradoxically, then, we see that the introduction of pricing enables roads to accommodate more peak-hour trips. It is therefore useful to think of pricing as a means of managing peak-hour travel demand rather than reducing it.
Pricing Strategies Will Be Particularly Valuable in Los Angeles
Pricing holds promise for most major cities, but the case in Los Angeles is especially compelling. To understand why, it is necessary to consider the interactions between population density and travel behavior, factors that help to explain the severity of LA traffic.
Contrary to its reputation for sprawl, Los Angeles is quite densely populated when viewed at the regional scale. Downtown Los Angeles isn't as dense as, say, Manhattan or central Chicago, but the suburbs surrounding Los Angeles are much denser than the typical suburb, leading to high aggregate density on a regional basis.
As population density increases, individuals tend to drive less on a per-capita basis. Trip origins and destinations are closer together, leading to shorter car trips, and in dense neighborhoods people can rely on alternatives such as walking, biking, or transit for a larger share of trips. Yet this can be overwhelmed by the fact that there are also more drivers competing for the same road space within a given area, thus intensifying traffic congestion. The net effect is that greater population density tends to exacerbate congestion—think downtown Manhattan.
LA traffic congestion is further exacerbated by the fact that Angelinos do not curtail their driving as much as one would expect in response to higher population density. Figure 4 compares per-capita vehicle miles of travel (VMT) and population density for the 14 largest metropolitan regions in the country.
Figure 4. Population Density vs. Per-Capita VMT for the 14 Largest U.S. Metropolitan Regions
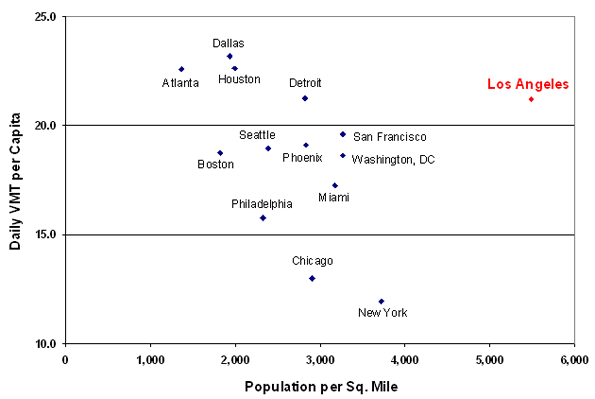
Looking across the different regions, there is a fairly consistent relationship in which per-capita VMT declines with regional density. Los Angeles, though, bucks this trend. The only other metropolitan regions with higher per-capita VMT (Atlanta, Dallas, Houston, and Detroit) are all much less dense than Los Angeles. For regions in which the level of density approaches that of Los Angeles (San Francisco, Washington D.C., and New York), per-capita VMT is much lower.
In short, we see a confluence of three density-related factors that combine to explain the severity of congestion in Los Angeles: (1) congestion is likely to rise with increased population density; (2) Los Angeles is much denser than its peers at the regional level; and (3) Los Angeles exhibits a surprisingly high level of per-capita VMT relative to its density. The third of these underscores the importance of pricing strategies as a means of managing the demand for automotive travel in Los Angeles.
In the end only pricing strategies promise sustainable reductions in traffic congestion. Other measures – including improvements in alternative transportation modes – can be beneficial, but none will be nearly as effective as pricing. This recommendation will no doubt stir controversy, but pricing offers the only realistic prospects for managing peak-hour travel demand in the most traffic-choked of American metropolises.
Dr. Paul Sorensen is an operations researcher at the RAND Corporation, wherehe serves as Associate Director of the Transportation, Space, and Technology program. Dr. Sorensen has published peer-reviewed studies in the areas of geographic information analysis, location optimization modeling, emergency response logistics, and transportation finance policy, and he also holds aU.S. patent on a methodology for forecasting the demand for ambulance services. Dr. Sorensen received a BA in computer science from Dartmouth College, an MA in urban planning from UCLA, and a PhD in geography from UCSB.


Congestion in LA ch III
Measuring truck performance vs. truck contribution to congestion (impacts)
In current practice, truck performance is most often measured in VMTs and VHTs. The approach focuses on a driver but does not inform about “costs” or comparative impacts on the region. It does not assess contribution made by PCs and trucks to congestion or consumption of roadway capacity. Planners need to develop measures which would enable them to evaluate these phenomena and evaluate impacts of the vehicle types in a comparable way. The most straightforward solution is to utilize: VMT multiplied by Passenger Car Equivalencies (VMT*PCE), Vehicle Hours Traveled multiplied by PCE (VHT*PCE), and delay multiplied by PCE (delay*PCE). A recent study, conducted in Oregon (ODOT), recommends three other useful measures, although, a bit more onerous and limited - they do not allow region-wide comparisons. Another measure that could be used to compare inter-regional conditions is VMT*PCE per lane mile of freeways, highways, or both.
Truck Logistics
Truck logistics in LA are “imperfect”/faulty. A geographical illustration of these logistics can be found on a map of warehousing, SCAG P&P TAC meeting of 8/11/10, “Goods Movement Update”, page 4. The region cannot afford to build-up on the logistics. New approach needs to be developed. Firstly, analysis of truck operations should be broken into three trip categories: (a) local/delivery trips, (b) out-of-region trips, and (c) in-transit/through trips. Then, one shall develop brand new logistics for the future and compare them to those currently projected. Finally, a realistic evaluation should be made - what can and what cannot be changed of the projected logistics. The evaluation should be based on real and inclusive cost-benefit analysis.
Different objectives can be set for each of truck trip category. For example: for delivery trucks one may want to minimize VMT or, potentially, minimize VMT of goods transported. The current trend of delivering more and more goods by super-heavy duty trucks circling the city and delivering a “case of beer” per destination should be reversed. The region needs more, smaller warehouses located in close distance to the customer. Then, smaller trucks can deliver “retail” orders, minimizing miles traveled. Specific, more focused objectives can be set for the other categories.
Traffic Congestion Geography
The freeway congestion, shown on Figure 1, indicates a radial pattern with a center in Downtown LA. Several maps that I’ve saved at various hours from PeMS web network and other services including Google, Yahoo, and Sigalert since 2007, confirm the above observation. In addition, one can see frequent, and apparently worsening, adverse conditions on SR-605 between SR-105 and SR-60 and on SR-91 east of SR-710. During peak periods there is substantial congestion on SR-101 between Downtown LA and west of SR-405. As for surface streets, I respectfully disagree with the conclusion that West LA has the worst conditions (see also “Moving Los Angeles”). As can be seen on Figure 2, and Figure 3.10 in “Moving Los Angeles,” the worst traffic conditions are in and around Downtown LA.
When you compare the traffic congestion patterns, especially those on the freeways, with a map of warehousing, mentioned above, it appears that they are spatially co-related. Somebody should conduct a GIS correlation analysis on the phenomenon.
Traffic Variability and Reliability
I reason that trucks are, at least partially, responsible for variability of traffic patterns in LA Region, especially during peak periods. Most of the other traffic during these periods – commuter traffic – has stable patterns. Other trip types (than Home-to-Work trips) have certain level of variability. The trip variability issue is worth exploring further/researching, since reliability is critical to improvement of mobility.
tbc
AiR-B
Congestion in LA - ch II
Demystifying Transit
Transit – at the last RTP, a witty professional implied that there is a common public misconception regarding public transit subsidies. The pro suggested conducting a study that would determine real transit subsidies v. real auto trip subsidies. The auto trip costs comprise of everything needed for driving automobile, including the costs of building and maintaining freeways, roads, operation costs of all sorts, congestion costs, health costs, etc. etc. The study could research the costs under current LA conditions (i.e., low density development), but also compare it to other places with more dense development and transit friendly policies such as San Francisco or Toronto, Canada. Perhaps these cities can tell us something about LA potential future. This is the challenge to academic community – who is up to it? The City of LA is trying to accelerate the schedule of future transit improvements. Can we help?
Trucks Taking Over Freeways?
Trucks – truck traffic is projected to grow massively. The region needs to consider carefully all potential benefits and costs, including ripple effects of the increase. The last RTP, Goods Movement Report, shows some of the potential impacts. Tables A8, A10 and A12 imply that future truck traffic will dominate LA freeways, jostling out autos. The autos may be left with little choice but to use surface streets instead of freeways. Passenger cars and drivers would incur extra delay, increased driving costs, increased pollution, etc. What will be the real costs of lost mobility for the residents of the region?
Tbc.
AiR_B
Congestion in LA
Very good article. I've read others, apparently related. The congestion caused by truck traffic seems to be under-reported if not underestimated. Considering the facts that a very rapid growth of truck traffic is projected, that the truck fleet changes - more super-heavy vehicles, a closer look into the truck caused congestion seems necessary. The measurements that are commonly used to estimate truck traffic increase - VMT - are not compatible with passenger cars VMT. VHT may not fully reflect impact of trucks on congestion. I would like to see a change to some statistically proper measurements.
Good Article
LA is one of those outlier cities that contradict definitions we use to define places. I've heard the term "dense sprawl" used to describe LA and I think it's very fitting, and too many people focus on density only in defining sprawl too. While it has a reasonably high density gradient over the entire metro area, it lacks a true central downtown / job concentration center, has very little mass transit use, and its land uses are oriented heavily towards automobile use. I think it's sprawl for every definition of the word, but that's not true in all circumstances.
I think something can be learned about sprawl, congestion, and metro areas by simply viewing Los Angeles -- as you have -- and comparing it to other metro areas in the US and even abroad. Good stuff.
still skeptical about those density numbers
I know you said you are considering regional density, but without seeing how you define the "region", that might cause the density numbers to be misleading. For example, if you look at Phoenix, it may be denser than Seattle when considering the giant footprint of all its outlying areas, but ignoring the fact that Seattle is incredibly denser and centralized at its core reduces the usefulness of the numbers you use for this comparison with VMT. The equivalent outlying areas of Seattle might be non-commuting farmland that unfairly bring down its density numbers, as opposed to the sprawling commuting suburbs of Phoenix which give a false impression of relative density. I'd be curious to see the same comparison using actual city limits instead of regions.
Regions defined based on urbanized area within MSAs
A note of clarification: the regional statistics presented within this article, and in the underlying RAND report, are based on only the "urbanized area" within a metropolitan statistical area. As defined by the Census, the urbanized area includes core blocks or block groups with a population density of at least 1000 persons per square mile plus periphery blocks or block groups with a population density of at least 500 persons per square mile. Any blocks or block groups with lower population density are not included in the calculations.
Excellent point
The whole city versus SMSA versus region gets very [statistically] confusing.
Great article
Excellent use of graphics.
I understand a LOT more about LA traffic than I did before.
Makes me very happy that I live in Denver.
Dave Barnes
+1.303.744.9024
http://www.MarketingTactics.com
About Pricing and Impact on Poor...
Thanks for this thought-provoking essay. One of the issues that has confounded earlier attempts at "volume pricing" has been the accusation such practices adversely affect the poor and lower middle classes due to lower elasticities of highway travel. This has certainly been cited in discussions about raising the gas tax even higher here in California.
I see in your piece that, "pricing has been shown to reduce the relative tax burden on lower income groups." If this case can be made more publicly, or, if there can be some sort of trade-off between gas taxes and user fees, this concept could receive greater public support.
Don't forget about land use patterns
Thanks for the thoughtful article. My only quibble comes with the statement "contrary to its reputation for sprawl, Los Angeles is quite densely populated when viewed at the regional scale". I've heard this claim made a few times in defense of LA not being "sprawl". The problem I have is not with the fact cited, but with the implicit definition of sprawl used. If the word "sprawl" is to have any use as a concept, then it cannot be simply a proxy for density. Figure 4 demonstrates this - there is clearly something going on in LA that is not captured by density but nonetheless causes it to merit the label of sprawl. I would argue that this "something" is the pattern of land use. It doesn't matter if you live in a residential neighborhood with 30 units to the acre, if the only thing that's around you for 1/2 a mile is other homes, then you're still probably going to drive to your destination. Auto dependence and land use segregation feed back on each other too, since residential areas will be unwilling to accept commercial establishments if they bring excessive traffic in with them. The result is the worst of both worlds, where residents get all the downsides of density with few of the benefits. A truly comprehensive solution to congestion requires addressing both transportation policies and land use policies.