The Department for Transport of the United Kingdom may be surprised to learn that the average round-trip commute in the nation is up to a quarter hour less than reflected in its reports. This revelation comes from an article in The Economist, ("Life in the Slow Lane") citing a survey indicating that the average commuter in the United Kingdom spends less than 40 minutes daily traveling to and from work in 2000. According to Regional Transport Statistics, published by the Department for Transport, the average commuter spent 50 minutes traveling to and from work in 2000. The UK government further indicates that the average commute time had risen to 56 minutes by 2009. The Economist relies on the much lower figure (and other similarly low estimates from other European nations) in fashioning an article criticizing transportation policy in the United States.
Shorter US Commute Times: The Economist begins with the contention that the average work trip travel time in the United States is substantially greater than that of the number of European nations. The most reliable data says otherwise.
The most comprehensive work trip data in Europe is maintained by Eurostat, the statistical agency of the European Commission. The Eurostat data indicates that average commute times in Europe are somewhat more than in the United States in metropolitan areas of similar size (Figure 1), when compared to the comprehensive data from the US Census Bureau. For example, among metropolitan areas of more than 5 million population, the daily round-trip average commute is under 58 minutes in the United States, less than the 64 minutes in Europe. European commute times are longer in all population categories (Note).
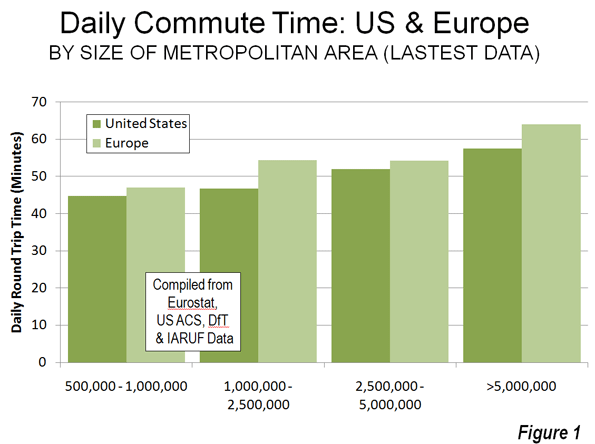
Overall, the average round-trip travel time in the US metropolitan areas over 500,000 population is 23.6 minutes and 25.3 minutes in the European metropolitan areas.
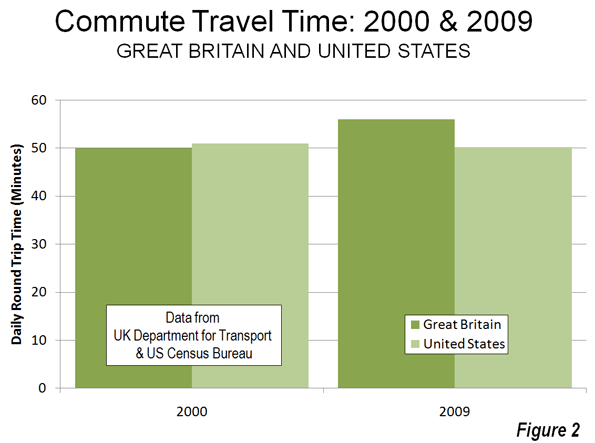
Moreover, there are indications that the US trend is favorable, at least in comparison to the United Kingdom. Between 2000 and 2009, UK government data shows average round trip commute times to have increased six minutes, while US government data indicates a decline of nearly one minute (Figure 2).
The US: Less Traffic Congestion: The Economist then asserts that traffic congestion is worse in US metropolitan areas than in Europe. According to The Economist:
...with few exceptions (London among them) American traffic congestion is worse than western Europe’s. Average delays in America’s largest cities exceed those in cities like Berlin and Copenhagen.
The reality is the opposite, according to the INRIX Traffic Scorecard and a more correct rendering of the point above would have been:
... with few exceptions (Los Angeles among them) western Europe's traffic congestion is worse than America's. Average delays in some of western Europe's smallest cities exceed those in cities like Atlanta, Houston and Dallas-Fort Worth.
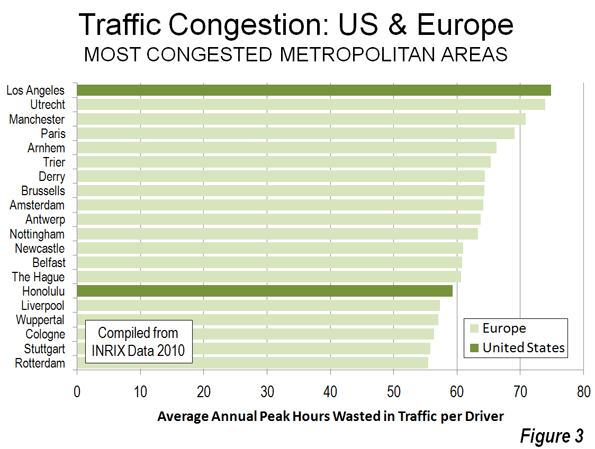
INRIX compared 2010 peak period traffic delays in metropolitan areas of the United States and Europe. As with commuting time, the average travel delay per driver was greater in Europe than in the United States in every population classification. While Los Angeles has the worst congestion the approximately 200 metropolitan areas (one-half in the US and one-half in Europe), the next 13 worst were in Europe (Honolulu ranks 15th) and 18 of the worst 20 were in Europe (Figure 3). The third worst ranking US metropolitan area was San Francisco, at 28th, while Washington was 29th. Only seven of the 50 most congested metropolitan areas were in the United States. Of course, anyone who has driven extensively in the metropolitan areas of the US and western Europe knows that congestion is generally far worse in Europe, a fact confirmed by the INRIX data.
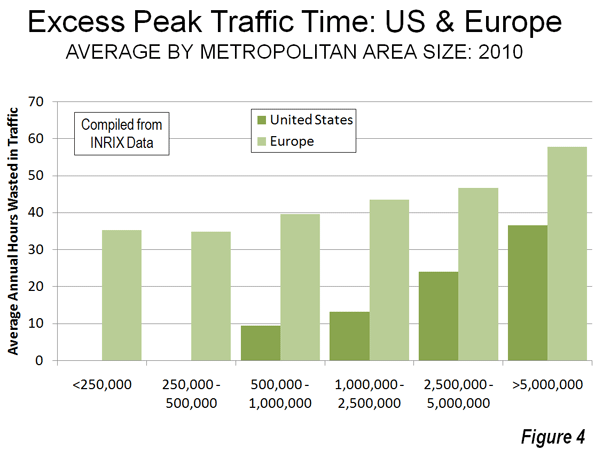
Indeed, traffic congestion in the smallest European metropolitan areas (under 500,000) was worse than in the largest US metropolitan areas, those with over 5 million (There were no US metropolitan areas with less than 500,000 population in the INRIX data, see Figure 4). Those automobile-oriented, highly suburbanized banes of urban planning, Atlanta, Dallas-Fort Worth and Houston all ranked in the middle, between 90th and 110th. At least 75 European metropolitan areas had worse traffic congestion than all three.
High-Speed Rail Envy: Finally, The Economist decries the lack of high-speed rail in the United States, noting that:
The absence of true high-speed rail is a continuing embarrassment to the nation’s rail enthusiasts.
It is hard to imagine a more pathetic standard for evaluating public policy than "satisfying rail enthusiasts." It is well known that that governments from Washington to London, Athens and Lisbon are in serious financial difficulty. It is a time for limiting public expenditures to matters of genuine priority. That does not include high speed rail.
The intercity road and airport systems are principally financed by users, in contrast to the operating subsidies and intense (100 percent) capital subsidies required by high-speed rail. This is evident in California with its now $65 billion first line that has more than doubled in real cost in a decade. It is also evident, closer to home for The Economist, where the controversial HS-2 high-speed rail proposal from London to Manchester and Leeds could easily double in cost (to £65 billion), based upon the best international research. Astoundingly, a doubling of cost would be a bargain for Britain's taxpayers compared to two previous high-speed rail failures in the same corridor (See: The High Speed Rail Battle of Britain). The recurring environmental justifications ring hallow due to the high costs and the three generations or more it would require in California and the United Kingdom to eliminate the first gram of greenhouse gas.
Transport policy could be improved in the United States, as well as in Europe. However, the starting point must be facts, not fancy, and certainly not envy.
-------
Note: this analysis includes all data available for metropolitan areas in the United States (metropolitan statistical areas) and Europe (larger urban zones, the closest equivalent to US metropolitan areas). US data is complete, covering all 100 metropolitan areas with more than 500,000 population and is from the United States Census Bureau. European data is principally from Eurostat (94 larger urban zones and three from other sources). Paris data is from IAURIF (Institut d'aménagement et d'urbanisme de la région Île-de-France). Newcastle-upon-Tyne and Leeds data is from the UK Department for Transport. Data is not available for a number of metropolitan areas with more than 500,000 population in Europe.


Very nice article, I enjoyed
Very nice article, I enjoyed reading your post, very nice share, I want to twit this to my followers. Thanks!.
5 ways to get ur ex back
Wonderful article, thanks
Wonderful article, thanks for putting this together! This is obviously one great post. Thanks for the valuable information and insights you have so provided here.
Katie
Thanks for sharing the info,
Thanks for sharing the info, keep up the good work going.... I really enjoyed exploring your site. good resource...
https://rebelmouse.com
Excellent website you have
Excellent website you have here, so much cool information!..
how to delete facebook activity log posts
This is a great inspiring
This is a great inspiring article.I am pretty much pleased with your good work.You put really very helpful information...
girlfriend activation system overview
Its a great pleasure reading
Its a great pleasure reading your post.Its full of information I am looking for and I love to post a comment that "The content of your post is awesome" Great work.
girlfriend system v2 pdf
This is very interesting
This is very interesting content! I have thoroughly enjoyed reading your points and have come to the conclusion that you are right about many of them. You are great.
christian girlfriend activation system
This is highly informatics,
This is highly informatics, crisp and clear. I think that everything has been described in systematic manner so that reader could get maximum information and learn many things.
https://www.rebelmouse.com/mikewaldenacnenomorereview/
very interesting post.this
very interesting post.this is my first time visit here.i found so mmany interesting stuff in your blog especially its discussion..thanks for the post!
Dark Post Profits Review
As a European who has lived
As a European who has lived in US for over 16 years I have concluded that there is a pernicious prejudice against passenger rail in the body politic, more pronounced in the hard core factions of the Republican party but also evident in the Democratic party. The most benign explanation for this is a wilful ignorance of what a reliable and efficient inter city railway can do for society. This is based on the current outlook on the appalling status quo in the railway system described at the beginning of this article. The circular argument runs along the lines of "We will not borrow money on investing in railways because they don't work and are useless. Just look at the national railway system. This political position is reinforced by pressure from the influential highway construction lobby not to divert transport funding from highways to railways. Obama's recent attempts to increase investment in inter city railways has come to nothing as a result of intense pressure from the Republican party in the latest spat over deficit reduction.