
Income inequality is an increasingly dominant theme in American culture and politics. Data from the IRS covering mean and median income of filing households for 2012 by zipcode allow us to map and interpret the fascinating geography of income differences. Where are the richest areas, the poorest and the most unequal?
The IRS data do not give us the distributions of incomes, so this report does not tell us where the largest numbers of rich or poor populations will be found; this can be done from the American Community Survey for large enough units of geography. With the IRS data, the median is the income of the household halfway between poorest to richest after all are ranked by income. The mean, or average income, is the aggregate income of all households divided by the number of households filing a return.
Most of the over 44,000 US zip codes have a sufficient mix of lower to higher income households that they do not stand out as extremely rich or poor. Even many zips with very low mean or median incomes are not so extreme since most of the poor population actually lives in more mixed income areas. Very unequal areas are defined here as having a far higher mean than median income, indicating an imbalance of incomes, e.g. a few very high income households inflate the average over the more typical, median income.
The Richest Zip Codes
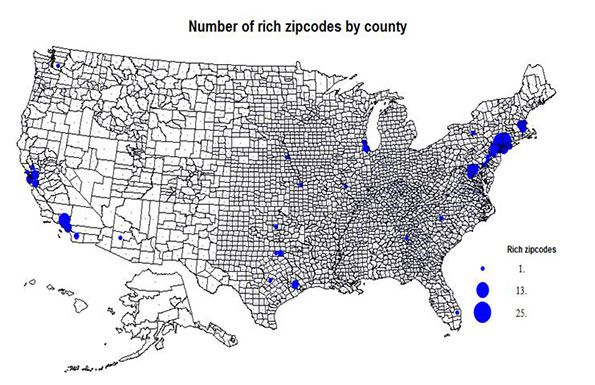
Figure 1 maps the 170 zip codes with more than 1000 people and median incomes over $150,000 or mean incomes over $200,000. The most astounding thing about the map (which shows the number of rich zip codes by the county they are part of) is their concentration in a few areas, led by the country’s premier global city, greater New York city, with 75 of the 170. New York is followed by Washington DC with 23, another sign of the growing wealth of the national capital. Boston follows with 10, Los Angeles, 18, San Francisco (14), and Chicago (6) and then a scattering in other leading metropolitan areas. There is no such concentration of the super-rich in any rural or small town area. But many are quasi-rural suburban and exurban.
| Richest Zip Codes | ||||
| State | County | Place | Zipcode | Mean (thousands) |
| NY | Westchester | Purchase | 10577 | 363 |
| NY | Nassau | Westbury | 11568 | 351 |
| IL | Cook | Kenilworth | 60043 | 342 |
| NY | Westchester | Pound Ridge | 10576 | 338 |
| CA | San Mateo | Atherton | 94027 | 337 |
| PA | Montgomery | Gladwyne | 19035 | 333 |
| CA | Los Angeles | Bel Air | 90077 | 327 |
| NJ | Essex | Short Hills | 07078 | 322 |
| NY | Nassau | Glen Head | 11548 | 316 |
| CT | Fairfield | Weston | 06883 | 286 |
| CT | Fairfield | New Canaan | 06840 | 308 |
| IL | Cook | Glencoe | 60022 | 297 |
But, the reader will protest, there are huge numbers of rich folk in Texas, Florida, Ohio, Pennsylvania, and other states. The reason is that these many rich households are “diluted” in impact because the zip codes are more variable in income. There really is something remarkable about the overwhelming affluence of the key suburban areas of Westchester and Nassau, New York; Fairfield, CT; Fairfax, VA; and Howard and Montgomery, MD. But I believe the map is telling and accurate at highlighting the utter dominance of the economic power of New York and then Washington. Boston retains power beyond its size, while Los Angeles, Chicago, San Francisco, and upstarts in the South scramble for a place.
The Richest Areas
The zip code with the highest and the 4th highest incomes are in Westchester County, close to the Connecticut border. The second richest, Westbury, is in Nassau county, New York, which also has the 9th richest. Also in the NYC suburbs are the 8th, in New Jersey just 20 miles west of New York, while 10th and 11th richest are both located in Fairfield County, CT.
Chicago’s north Cook county has the 3rd (Kenilworth) and 12th (Glencoe) richest areas. Los Angeles is home to the 7th richest, Bel Air (northwest of Beverly Hills), Atherton, in San Mateo county, is the 5th richest, and Gladwyne in Montgomery County, PA is the 6th richest. Greater New York then is home to 7 of the 12 richest, followed by Chicago with 2. Quite a concentration.
The Poorest Zip Codes
The list and map (Figure 2) of counties with poor zip codes may surprise the reader more. I divide the 94 poorest areas into five types:
- minority population domination, 35 areas,
- college or university student majorities, with 25 places,
- rural (in the sense of small communities in these counties having been left behind or declined) some 25 areas,
- five inner city areas dominated by single men, 5, and
- two areas dominated by a large military base.
The poor college areas are zip codes for student dormitory housing, people who are temporarily poor; some military base areas are similarly poor because of barrack housing of single people.
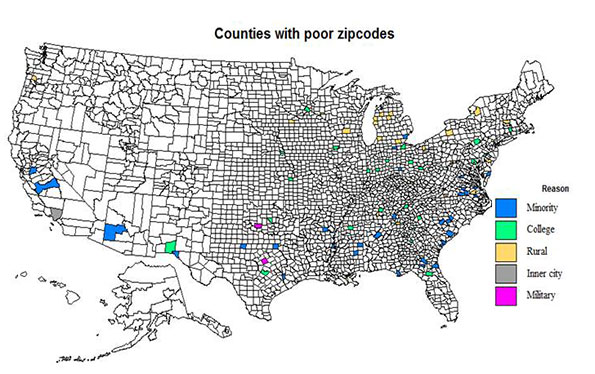
The poorest minority dominated areas are mainly Black and in the rural to small city South, except for a few Hispanic dominated areas in the west. The college poor areas are scattered across the country, especially in the East, the military base communities in Texas and Oklahoma. The rural set is surprisingly concentrated mainly in the north, especially in Michigan. The few inner city poor areas are in Los Angeles, Waterbury, CT: Portland, OR; Youngstown and Canton, OH; an odd set. A few of the rural areas also have correctional institutions.
| Poorest Zip Codes | ||||
| State | County | Place | Zipcode | Median |
| NE | Douglas | Omaha | 68178 | $2,499 |
| KY | Elliott | Burke | 41171 | $3,494 |
| GA | Clinch | Cogdell | 31634 | $3,886 |
| FL | Gulf | Wawahitchka | 32465 | $4,481 |
| CT | Tolland | Storrs | 06269 | $6,124 |
| WI | Dane | Madison | 53706 | $6,359 |
| VA | Nottoway | Blackstone | 23824 | $6,421 |
| MI | Clare | LeRoy | 49665 | $6,639 |
| TN | Rutherford | Murfreesboro | 37132 | $7,125 |
| IN | Delaware | Muncie | 47306 | $6,750 |
| NY | Cattaraugus | Salamanca | 14779 | $7,395 |
If I had relaxed limit by including more smaller population areas, or not quite such low incomes, many more college, military base, minority majority counties would appear on the map. But as noted up front, virtually none of these poorest zip codes are in big cities or their metropolitan areas, where millions of poor households live, simply because these metro zip codes tend to be large and more heterogeneous. This also does not factor in the cost of living, which can be high in some regions, particularly on the east and west coasts.
The Poorest Areas
The 12 poorest zip codes are different and quite varied in character. Five of the zip codes are essentially college or university student housing, and thus not indicative of an adult working population. Three areas are in part poor because of the presence of correctional institutions or adult care institutions. Two of these also have a significant minority (Black) population. Two rural areas, in GA and VA have high Black shares. This leaves two northern rural areas in Michigan (high seasonal dependency) and in New York, Salamanca, also a seasonal resort, as well as an Indian reservation.
Unequal Zip Code
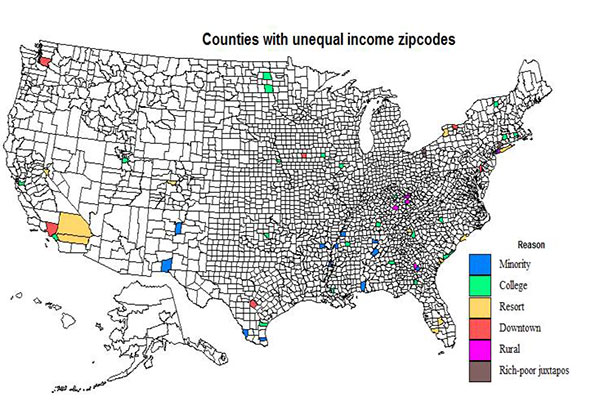
The unequal zip codes (67) are mainly areas where the mean is at least twice the median, showing the disproportionate effect of a few very wealthy households. One critical area for high inequality are primarily beach or mountain communities with richer retirees serviced by lower-paid workers; these include 13 areas in California, South Carolina, Florida, New York, Nevada, North Carolina, and Colorado. Downtowns (8 areas) include a few actual downtown CBD zip codes with an older poor population and newer rich folk. Rural here identifies mainly small Kentucky zip codes with a very imbalanced income pattern (7 areas). Finally I note a few zip codes in exurban areas where there appears to be a juxtaposition of an older resident population, and newer wealthier households (3 areas). This pattern may become more common in both exurban and rural small-town environmental amenity areas.
| Most Unequal Zip Codes | |||||
| State | County | Place | Zipcode | Median | Mean |
| CA | Alameda | Berkeley | 94720 | $16,192 | $79,238 |
| SC | Pickens | Clemson | 29634 | $12,159 | $51,444 |
| LA | E Carroll | Transylvania | 71286 | $28,961 | $96,377 |
| TX | Starr | 3 zips | 78536etc | $29,722 | $98,048 |
| KY | Elliott | Ezel | 41425 | $29,980 | $65,676 |
| TN | Rutherford | Murfreesboro | 37132 | $7,125 | $21,863 |
| MA | Suffolk | Boston | 02111 | $31,442 | $62,087 |
| VA | Radford | Radford | 24142 | $15,931 | $46,860 |
| ND | Cass | Fargo | 58105 | $24,750 | $70,633 |
| DC | DC | WashingtonDC | 20006 | $12,103 | $32,155 |
| TX | Bexar | San Antonio | 78205 | $25,779 | $69,628 |
| NC | New Hanover | WrightsvilleBch | 28480 | $70,375 | $184,658 |
| NV | Douglas | Glenbrook | 89413 | $68,512 | $172,004 |
The Most Unequal Areas
Of the 13 most unequal areas, 6 are college or university zip codes, areas with poor students and much higher income professionals. Two are downtown zip codes, Boston and San Antonio, two are minority population areas, Louisiana and Texas. Two are resort areas, in Nevada and North Carolina, but several similar areas are not far down on the list. One Kentucky area is classed as just rural, but again other similar counties are on the fuller list.
Several zip codes are on both the poorest and the unequal zip code lists, most commonly the college and the minority-dominated areas. Rich suburban and exurban areas tend to be fairly consistently rich, resort areas tend to be more unequal.
Conclusion
The zip code data provide a partial, highly localized look at the geography of inequality. If American society continues to accept extreme income, the geography of inequality will only become not only more extreme, but more pronounced in a diverse set of locations.
Richard Morrill is Professor Emeritus of Geography and Environmental Studies, University of Washington. His research interests include: political geography (voting behavior, redistricting, local governance), population/demography/settlement/migration, urban geography and planning, urban transportation (i.e., old fashioned generalist).


proofread?
Informative piece, but someone seriously needs to copy edit this. I'm not a nitpicky internet troll, but this article is out of control, and an embarassement both to Mr. Morrill and this website.
-the "0" is dropped when it is the first digit of a zip code, in all the zip code lists
-in the section under the "Richest Areas" heading: it is WestBURY, not WestBORO, NY. You have it right in the list, wrong in the text. Also, Short Hills, NJ is 20 miles west of New York, not Newark (it is west of Newark, but not nearly as far)
-the article both misspells, and fails to capitalize, Montgomery County, PA, in two separate place
-random and inconsistent use of quotations when stating the heading ["The Poorest" Zip Codes]
-terrible grammer: "the rural set is surprisingly concentration..."
I am an avid reader and fan of this site, so I know this is a rare aberration. I point this all out in hopes that Newgeography.com can maintain its normally high standards going forward.
Thanks, Jay. We try to keep
Thanks, Jay. We try to keep the copy in good shape, but mistakes happen sometimes.