
Many public sector mavens watch like the Dow Jones average the shares of workers using various modes of transportation on work trips to see how their favorite mode is doing. One shouldn’t be surprised when a certain hyperbole creeps into the interpretation of the trends. But in reality not a whole lot is changing, despite many assertions of ballooning growth from some sectors.
We should start in 1960 with the first census to cover the Journey to Work. Back then about two-thirds of workers used a car or truck. More interestingly 13% were on transit, 10% walked and 7% worked at home (think farmers). As Figure 1 indicates, effectively all of the growth in the last 50 years has occurred in the private vehicle mode. The melding here of walking and working at home misleads a bit because walking has continually declined while, due to the internet, working at home – once the farm decline reached bottom – has been the “mode” with the greatest and most consistent share of growth in the period.
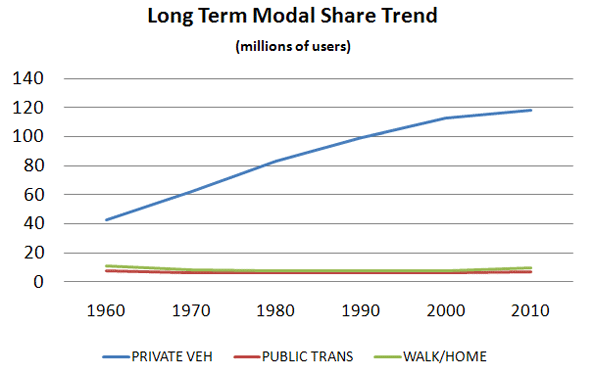
Source: 1960-2000 decennial Census; 2010 ACS
Meanwhile the transit and walk modes have declined in share since the last half century but seem more recently to have bottomed out and reached some base level. 1
Table 1 shows the relatively stable pattern for the last 20 years in broad terms.
|
1990 decennial |
2000 decennial |
2010 ACS |
|
|
WORKERS |
100% |
100% |
100% |
|
DRIVE ALONE |
73% |
76% |
77% |
|
CARPOOL |
13% |
11% |
10% |
|
TRANSIT |
5% |
5% |
5% |
|
TAXI |
0% |
0% |
0% |
|
BICYCLE |
0% |
0% |
0% |
|
WALKED |
4% |
3% |
3% |
|
OTHER |
1% |
1% |
1% |
|
WORKED AT HOME |
3% |
3% |
4% |
For Figure 1 and Table 1, the 2000 and earlier data are from the decennial censuses. The 2010 data are from a new source, the American Community Survey, which seeks to replicate the census structure. These data are therefore not strictly comparable. It has been observed that the ACS has tended to understate carpooling and overstate transit despite best efforts to assure comparability.
Given the breadth of coverage of the census, it has immense value but a better handle on the mode share question can be found in the National Household Travel Survey (NHTS) of the Federal Highway Administration. It replicates the census question asking about the usual mode of commuting, but it asks it as part of a collection of a complete diary of a day’s travel for each member of the household. It gets the what did you do yesterday response as well for the same person. That means we can compare the person’s responses to the two separate queries and learn a great deal about the relationships between the responses.
This comparison between census and NHTS products helps state and metro planners know how their surveys might map to the census and helps test the utility of the census products. Just as importantly, it provides a comparison between what people say they do and what they actually do and it tells more about what alternatives travelers shift to when they don’t do “the usual”.
When the NHTS asks the question in the “actually-did-yesterday” format things change, in some cases appreciably.
|
'Usual' |
On Travel Day Commuted by: |
|||||
|
Commute |
||||||
|
Mode: |
Drove Alone |
Carpool |
Transit |
Walk |
Bike |
Other |
|
Drove Alone |
93.5 |
5.6 |
0.1 |
0.5 |
0.1 |
0.4 |
|
Carpool |
42.9 |
54.8 |
0.5 |
1 |
0 |
0.8 |
|
Transit |
13.2 |
9.2 |
68.3 |
6.6 |
0.8 |
1.9 |
|
Walk |
6.1 |
9.3 |
3.4 |
80.2 |
0.2 |
0.7 |
|
Bike |
13.8 |
3.3 |
6 |
2.6 |
73 |
1.4 |
|
Other |
64.1 |
19 |
4.2 |
4.3 |
0.3 |
8 |
Source: NHTS 2009
Quick Findings
If we study the yellow boxes we see the “loyalty” relationship between what people say they do and what they actually do. There are some interesting stories here.
Drove alone: According to the NHTS, 93.5% of the people who said they usually drive alone to work actually did. When they didn’t they almost exclusively shifted to carpooling, with only about 1% shifting out of the auto mode. This is basically identical to the responses in the 2001 NHTS.2
Transit: Only about 68.3% of usual transit users actually used it on a specific day. The big shift is to the auto-based modes, solo driving or pooling, accounting for more than three quarters of the shift, with the remainder largely shifting to walking. This is almost the identical loyalty share observed in 2001, but with greater shifts to the auto instead of walking.
Walking: Surprisingly about 80% of those who say they usually walk actually do. Again, when these commuters don’t walk, about three/quarters of the shift is to the private vehicle, with the remainder largely shifting to transit. Also very similar in loyalty to 2001 measures, but showing some increase in transit shifts.
Bicycle: biking exhibits a little less “loyalty” than walking and a little more than transit. Biking showed a decrease in loyalty from the 77% observed in 2001, perhaps reflecting that the increases in biking we have seen among less inveterate bikers. The shift to the auto-based modes is less pronounced than the other cases with about a 63% share of the shift. Transit and walking each obtain appreciable shares of the remainder. Use of the auto modes as an alternative increased substantially from 2001.
Carpooling: Carpooling is the great surprise. While transit exhibited the lowest level of loyalty of all modes in 2001 it was surpassed by carpooling in 2009. Carpooling showed a dramatic decrease in loyalty from 75% in 2001 to 55%, in 2009. The dominant shift is to driving alone with only about 2% shifting to non-auto modes. So the auto-based share remains about the same as in 2001.
What to Make of All This
In today’s world we have seen substantial increases in variability in trips to work – variability in time of departure, arrival, choice of route to work, even a choice as to whether or not one travels to work at all with telecommuting becoming more significant every day. We should not be surprised that there is variability in choice of mode of travel. Some part of this may simply be that some workers see transit, biking, or walking as the socially preferred modes and will state so when asked – kind of the “good citizen” response – they know what they are supposed to want – “but yesterday was different!”
Clearly, auto users tend to remain auto users, with a 98-99% loyalty whether in a carpool or driving solo. Shifting either way often means things like: the car is in the shop, my wife needs the car, or carpool buddy is on leave, lost a job, or busy doing something else. This does tell us that carpooling is becoming less formal and more of an occasional and more flexible activity, abetted by cell phones and apps. One could speculate that these workers often do not have a serious option to the auto.
Transit users’ swing is substantial, with significant implications. Actual users come in at 3.7% of travel rather than the 5% shown for the “usually use” response. About 3.5% are the usual transit riders who are actually using transit. In terms of survey response reliability we are dancing on the thin edge of trustworthy responses in terms of observation density. But even with that caveat it would seem appropriate for transit providers to recognize that a significant portion of their riders are “in for the day” because their usual circumstance changed. Also worth noting is that given that auto users are about 20 times the number of transit riders, an insignificant shift from auto to transit – unnoticeable on the roads – could swamp transit use. If all the car users had their car in the repair shop once a month it could double transit use in most regions.
Walkers and bikers, who are those most likely to be affected by weather, both do better than transit in terms of brand loyalty. This may all be a product of trip length. It has been observed in the past that walkers have an average trip length that is typically so short (circa 15 minutes or about a mile) that transit (given typical wait times of close to 15 minutes) is not a realistic option so on bad weather days the car may be the substitute. Bike trip lengths to work may be significantly longer than walking so that transit can become a viable option, depending on wait times and routing.
Alan E. Pisarski is the author of the long running Commuting in America series. A consultant in travel behavior issues and public policy, he frequently testifies before the Houses of the Congress and advises States on their investment and policy requirements.
Photo by Nathan Harper, Bottleleaf
-----------------


Mode of Transport
Though there are different modes of transit available but as trends changing it affects the way transportation happened and well it depends on the people how they are reacting to it. one more thing it's the edge of technology and there are various mediums of transport system and also we found the technology rich vehicles on road to limit our time of transport.
The topic you've shared is
The topic you've shared is interesting. Thanks for sharing this.
purchase vimeo views
..I am happy to find this
..I am happy to find this article.!!.
..This is really great.!!. I’ll definitely be back for updates..
..There are lot's of interesting topics, I loved reading them and I am searching
for this kind of informative information. Thanks guys most especially to the admins,.."God Bless"..
.
.
.
real twitter favorites
Product name and branding
Product name and branding really matters. The success is within the right name idea they have used. Today, people cares about the product brand, when it comes to popularity they always into it.
Regards.
Evan
"works for http://eatmywords.com/, a business naming firm."
First of all Good day! I
First of all Good day! I would just like to give thanks to the admin who posted this one I really appreciate it thank you.
Yeah right I totally agree with you! One shouldn’t be surprised when a certain hyperbole creeps into the interpretation of the trends. But in reality not a whole lot is changing, despite many assertions of ballooning growth from some sectors. Keep up the good work and Godbless! Anyway I am here to promote real twitter favorites. Guys we are real and legit.
Be with us to, get Twitter favorites
As compared to earlier days,
As compared to earlier days, we find that workers usually prefer to take public transport. Public transportation is the best way to travel from one place to another at a fair price. Many workers also prefer to do car pooling, car pooling is the best way to save fuel and money. I suggest that workers should prefer car pooling, as this will also cost less, and also it will take you to the desired location. But before car pooling one should take the car to the audi repair calabasas for servicing for good performance of the car.
MPLOA Spirulina Chlorella
This little trimmer reminds me of a higher powered nose hair trimmer (with attachments). I have a long distance relationship with my boyfriend, so I figured I would purchase my first vibrator for the time being.First of all, I can't say enough about the packaging. The shipping was fast and the cable worked perfectly. The pitcher which I purchased through Amazon.com fits quite well on a shelf in the refrigerator door. Pukka Herbs Organic Chlorella http://www.mploa.org/1/chlorellasite/
I would have saved a lot of money by buying a small grinder and a $20 drip coffee maker. The only caution is that--with the saw attached--it is not light weight. English language manual, easy to follow and to use. Spirulina Ktos http://www.mploa.org/1/chlorellasite/ Spirulina Y Sistema Inmunologico
Car brands
In this current time period we have found various kinds of people around the world those are basically prefer brand collections. No doubt this is a good activity best brand suggest best quality but hike in price also. Here in this above article we have found multiple reports about how people using transport and the vehicle for the way of communication in between their work and home. This census report shows that how much people were choosing cars and other types of transportation service to reach their work place from their homes. Apart from car and heavy vehicles, there are people those are using bikes for communication. But the real fact is that everyone needs the help of vehicle repair and service center to keep their vehicle in better condition. I think from here we can get sufficient knowledge about vehicle repair & service centers.
Loyalty
"Surprisingly about 80% of those who say they usually walk actually do". I believe good service must become a good loyalty for customers. These days carpooling also dramatically increases among the people that drives them into brands.