
The 2010 Census results were mostly bleak for cities, especially for those who believed the inflated hype about the resurgence of the city at the expense of the suburbs. Despite claims of an urban renaissance, the 2000s actually turned out to be worse than the 1990s for central cities. The one bright spot was downtowns, which showed strong gains, albeit from a low base. The resurgence of the city story seemed largely fueled by intra-census estimates by the government that proved to be wildly inflated when the actual 2010 count was performed.
But beyond the headline numbers, there is intriguing evidence of a shift in intra-regional population dynamics in the migration numbers. The Internal Revenue Service uses tax return data to track movements of people around the country on a county-to-county and state-to-state basis. These can be used to look at movements of people within a metro area.
Because this data is at the county level, it does not map directly to what we might think of as the “urban core” as most counties that are home to central cities contain large suburban areas as well. There are also areas inside many central cities themselves that are suburban in their built form.
However, there are a limited number of cities that have combined city-county definitions that approximate the urban core. Looking at a few of these – New York, Philadelphia, San Francisco, and Washington, DC – we see that over the 2000s out-migration from the core to the suburban counties was relatively flat or even declined late in the decade as general mobility declined in the Great Recession. In contrast, migration from the suburban counties to the core stayed flat or actually increased, even late in the decade when again overall migration declined nationally.
It should be stressed that the overall trend is still that of net out-migration from the core to the suburbs. But in searching for any potential inflection point, changes in the dynamics are clearly of interest.
New York City
First let us look at New York City. The city proper consists of five boroughs, each of which is a separate county. Treating the city as a whole as the core reveals these migration trends during the 2000s:
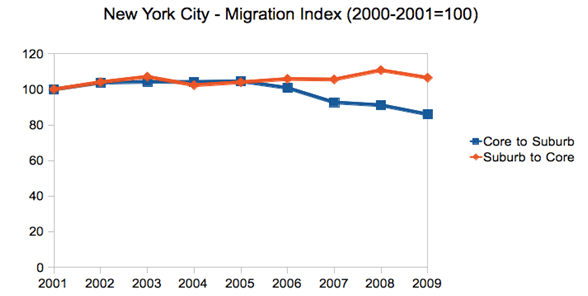
Note: Core defined as the five boroughs of New York City
This chart renders migration as an index, to show changes in in- and out-migration on the same scale. This should not be confused with the total number of people moving, which still shows overall net out-migration, though the trend lines show the same dynamic as above:
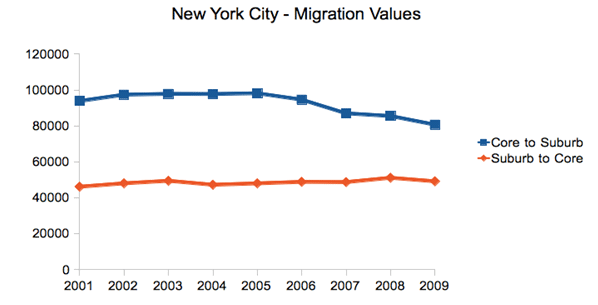
Note: Core defined as the five boroughs of New York City
Philadelphia
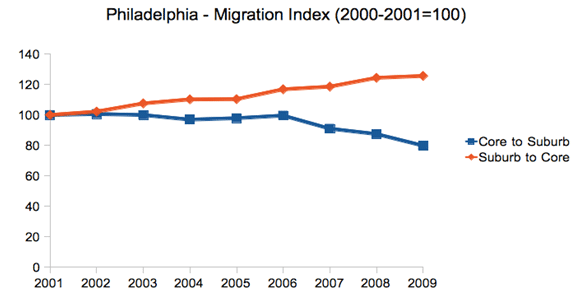
Perhaps the most dramatic shift in these four cities was in Philadelphia, where the central city actually gained population for the first time since 1950.
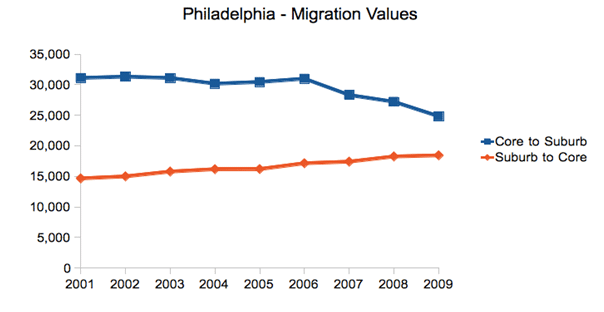
Here are the raw migration numbers, which again show net out-migration, but a distinct shift over the decade.
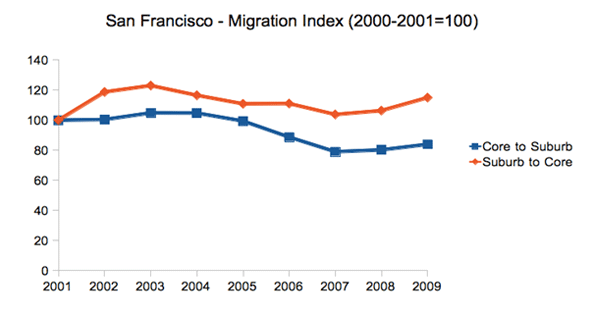
San Francisco
The Bay Area has been divided into two metro areas by the government, San Francisco and San Jose. Therefore, an intra-regional migration analysis looking at San Francisco alone will miss certain migration within the broader Bay Area. With that caveat in mind, we see again the same trend, albeit somewhat less pronounced:
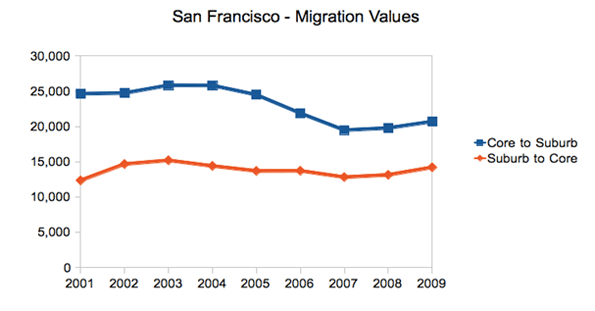
And here are the total migrants:
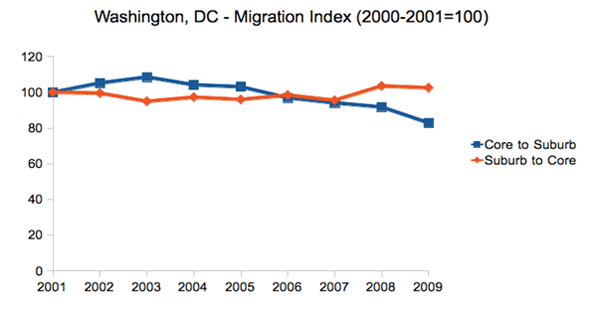
Washington, DC
Due to its very nature as a government town, Washington’s migration patterns differ from the many other cities. However, it has still experienced the same suburbanization phenomenon as the rest of America, and the same changes in intra-regional migration dynamics as the other cities highlighted here, though we see the shift beginning only in mid-decade:
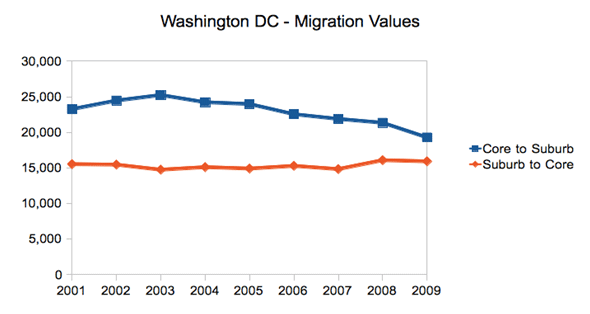
And the raw values:
Conclusion
Given the overblown triumphalist rhetoric about the urban core that ultimately hasn’t been backed up by the data, we should be cautious about reading too much into this. Again, net migration remains outward towards the suburbs and away from denser cities to smaller, generally less dense ones (from Chicago to Indianapolis or New York to Raleigh). Overall city population figures were disappointing. And the housing crash and the Great Recession have clearly wreaked havoc with migration patterns on a national level.
Still, these are clearly figures that should inspire some at least small-scale optimism in urban advocates. There has clearly been a shift affecting the net migration in these cities. And the same pattern is visible, though less easily attributable to just the urban core, in a large number of other metros around the country. In particular, the fact the in-migration from the suburbs to the core held steady or even increased is a sign of some urban health.
Back to the city as a mass movement? Not yet. But it’s certainly an improvement. These intra-regional migration statistics are key figures to keep an eye on as we look for any sign of a true inflection point in the overall population trends for America’s urban centers. The whole pattern could also shift again --- in one direction or the other --- as the economy, albeit slowly, comes back to life and people once again get back into the housing market.
Aaron M. Renn is an independent writer on urban affairs based in the Midwest. His writings appear at The Urbanophile, where this piece originally appeared. Telestrian was used to analyze data and to create charts for this piece.
Chicago photo by Storm Crypt / Flickr


nice information amazing and
nice information amazing and greatings harga mobil bekas
yamaha mio m3 125 blue core
I must say, I thought this
I must say, I thought this was a pretty interesting read when it comes to this topic. Liked the material. . .
http://unlockherlegsdownload.com
Thanks for a wonderful
Thanks for a wonderful share. Your article has proved your hard work and experience you have got in this field. Brilliant .i love it reading.
http://memyfriends.com/
Thanks for a wonderful
Thanks for a wonderful share. Your article has proved your hard work and experience you have got in this field. Brilliant .i love it reading.
http://memyfriends.com/
Thanks for a wonderful
Thanks for a wonderful share. Your article has proved your hard work and experience you have got in this field. Brilliant .i love it reading.
http://memyfriends.com/
used to analyze data and to
used to analyze data and to create charts for this piece.-------eko wahyudi - G+ on Wahyudie Eks
We stand behind our products
We stand behind our products quality and ensure that people can use them without any worries
http://7star.pk/
http://7star.pk/33_citizen-watches
http://7star.pk/new-products
Nice to be visiting your
Nice to be visiting your blog once more, it has been months for me. Well this article that ive been waited for therefore long. i want this article to finish my assignment within the faculty, and it has same topic together with your article. Thanks, nice share.
Victorino Noval Philanthropist
Pretty good post. I just
Pretty good post. I just stumbled upon your blog and wanted to say that I have really enjoyed reading your blog posts. Any way I'll be subscribing to your feed and I hope you post again soon. Big thanks for the useful info.
customer reviews
What a fantabulous post this
What a fantabulous post this has been. Never seen this kind of useful post. I am grateful to you and expect more number of posts like these. Thank you very much.
girlfriend activation system joke