
During the last decade, Los Angeles County grew by about 300,000, an insignificant figure for a region of 9.8 million people. As in the previous decade, the slight increase in population was made possible by an increase in the number of Latinos (10.5%) and non-Hispanic Asians (18%). But overall growth was slowed by a sharp decline in non-Hispanic white (7.4%) and non-Hispanic African American (8.5%) populations (see Table 1).
Less recognized, immigration, the demographic fuel that previously fed LA’s economic engine also has slowed down. With little in-migration from other states, we are beginning a new phase in our trajectory: aging together, native and foreign born.
This is a crucial moment in our history. We could be at the end of the period where Los Angeles thrived as a destination of choice for the working-age population and may simply begin to age, much like our counterparts in the Northeast. Is LA finally out of its “sunbelt” phase and entering its graying era?
Demographic Changes – An Overview
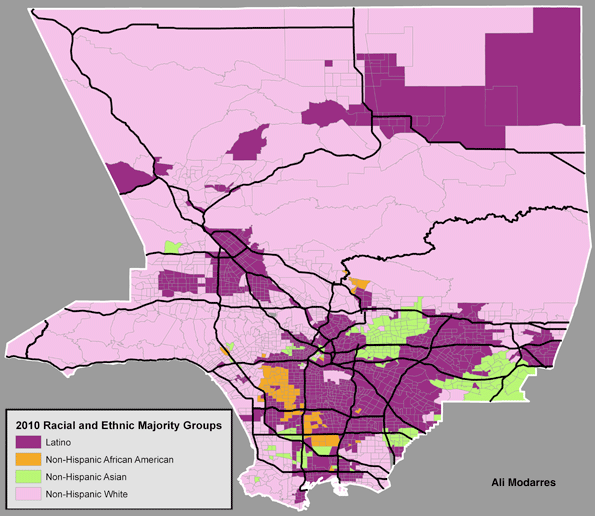
As Figure 1 illustrates, the geography of race and ethnicity has changed little over the course of the last few decades. Latinos have retained or expanded their majority status in a significant number of neighborhoods. Asian and Asian-American neighborhoods are highly concentrated in an area known as the San Gabriel Valley, while the non-Hispanic white population continues to dominate in areas outside the central city, with the exception of a few tracts in and around the Figueroa corridor (in downtown LA) connected with recent downtown development. Non-Hispanic African Americans have lost their majority status in some South LA neighborhoods where Latinos have come to outnumber them.
Immigration
California’s declining immigration can be attributed to a tarnished economic image of the state and its anti-immigrant sociopolitical environment. This might seem puzzling to many residents of Los Angeles, who live a very immigrant-rich environment.
First, are immigrants still coming to Los Angeles at the same rate as before)?
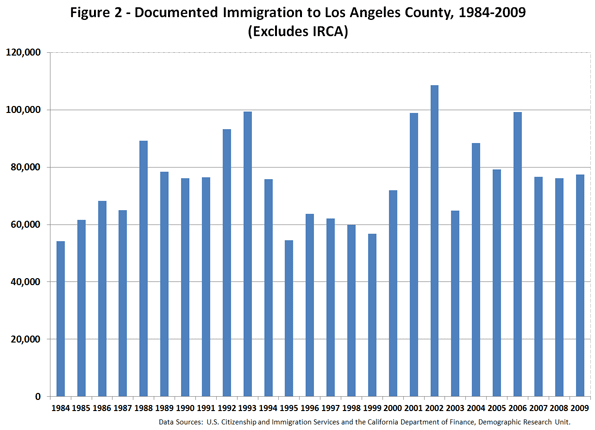
Figure 2 helps provide the answer to this question, by illustrating the annual immigration patterns to the county. The 2007–2009 period has seen less annual immigration, but the nearly 80,000 immigrants per year is as many or more than those from 1994 to 2000. Comparing the period of 1990–1999 with 2000–2009 illustrates that, during the last ten years, a larger number of immigrants have arrived in the county (718,166 versus 841,325).
But what seems clear is that if they are arriving in LA, fewer are staying for the long term. This secondary migration can be made visible by comparing the number of immigrants arriving in Los Angeles County with a tabulation of LA’s foreign-born population by year of U.S. entry.
The 2009 American Community Survey shows that, among the nearly 3.5 million foreign-born residents of the county, 909,692 arrived between 1990 and 1999 and 811,808 between 2000 and 2009 (see Table 2). Comparing these figures with the number of immigrants who arrived in Los Angeles during the same periods from their countries of origin (718,166 in the 1990s and 841,325 in the 2000s) indicates that we attracted more immigrants from the 1990–1999 cohort (a net gain of close to 192,000) and lost members of the 2000–2009 cohort (about 30,000).
Clearly the county lost its foreign-born population to other regions of the state and the nation. This is somewhat troubling since it reveals that the allure of the region may be waning among the working-age immigrant population. In fact, as Table 2 portrays, Los Angeles has gradually become home to an old-stock immigrant population, where the foreign-born population hails from earlier eras (i.e., the 1980s and the 1990s).
Does this mean that the foreign-born population is also getting older? The answer to this question is complicated. Based on 2009 American Community Survey (ACS) data, the average age of the foreign-born population in the country is slightly over 44, with 70% of the population falling between the ages of 27 and 62. This suggests that the immigrant population is a bit older than commonly expected. Also, with fewer than 6% of the foreign-born population being younger than age 18, it is clear that the number of children arriving is significantly less than often assumed.
Therefore, it may be crucial to ask a pointed question. Does Los Angeles have the appropriate economic infrastructure to attract new immigrant while keeping more of our working age immigrants? Considering the economic circumstance of the recent immigrants, the cost of living in Los Angeles, and the current economic and job environment, it should not come as a shock that many are leaving Los Angeles. After all, this is exactly what the native-born population has done throughout the history of the United States: leaving harsh economic conditions for better opportunities in other cities and states.
Native born
What about the native born population?
Surprisingly, with an average age of slightly over 30 years, the native-born population is younger than its foreign-born counterpart. This becomes clear as we compare the age structure of both groups. Among the working-age population, the foreign-born outnumber the native-born. However, among young and old residents, the native-born population is a larger group. Before jumping to any particular conclusion, we should be reminded that the native-born population includes a large number of individuals whose parents are immigrants. This means that the younger population is multi-racial and multi-ethnic in character. To illustrate this, I provide a detailed analysis of the native-born population in the following paragraphs.
As Table 3 illustrates, among those 0–19 years old (the first two columns), Latinos outnumber other racial and ethnic groups. This is more pronounced among those 0–9 years old. However, in every age category older than 19, the non-Hispanic white population outnumbers others. Interestingly, it is only among the age 60+ residents that non-Hispanic African Americans outnumber Latinos (124,587 versus 119,676). This information, combined with what appears on Figure 3, suggests our foreign-born population is aging and new immigrants are not arriving fast enough to keep their average age low. But at the same time their children (particularly among Latinos) are clearly a significant portion of the younger and the working-age population. This illustrates that our economy and social structure operate largely based on the dividends from past decades of high immigration. Without a renewed immigration pattern that expands the working-age population, our economic prospects are somewhat dubious.
LA’s Demographic Future
Table 4 provides a brief glimpse to our demographic future. Here we have the average age for the native-born population by race and ethnicity. With an average age of 20.6, native-born Latinos are younger than the non-Hispanic native- born population (at an average of 37.4). In fact, a significant majority of native-born Latinos are under age 40. This is in stark contrast to foreign-born Latinos who are, on an average, in their early 40s. Compared with an average age of 20.6 among native-born Latinos, the age gap between the two groups becomes clear, further highlighting the decline of younger Latino immigrants in Los Angeles.
Clearly the demographic path of Los Angeles County has been altered. We are becoming older and more native born. Blaming immigrants, the easy game of the last two decades, can no longer explain our social and economic ills. We need to embrace who we are and what our economy, politics, and collective decision making have brought to our doorsteps. It may be difficult to accept that we are getting older, but our region is losing young people as well. Table 5 contains the last bit of information we need to understand about how we became a region with a graying population.
Between 2000 and 2010, we lost residents in five age categories: 0–4, 5–9, 10–14, 25–34, and 35–44. This suggests that – as we have seen in other high-cost urban regions – young families are leaving! Among the working-age population, we were able to hang on to those 15–24 and age 45 and older. These individuals are from older families whose young adults (15–24) may or may not choose to stay in the region. With declining immigration and departing younger families, the Los Angeles region is on its way to becoming a much grayer place.
A Brief Note on Policy Options
To be sure, there is nothing wrong with aging. It happens to the best of us. However, one needs to plan for it. Los Angeles County can develop policies that benefit a working-age population and its pending retirement needs (or rethink why it has lost its luster to immigrants and the native-born population.
Unless conditions change, the ambitious children of immigrants will surely behave like other native-born citizens and look to regions where economic prosperity is most likely. High cost of housing, a less than satisfactory educational system, inadequate health services, and an inefficient transportation system might drive the second generation young families to other region.
The solution to the growing loss of our productive population does not lie in building more condos and subsidizing iconic places, such as downtown LA. We need more jobs a burgeoning economy to keep productive people here. This needs to be tied to the integration of immigrants and their children. Immigrants are not different from those who were born here. They also want the best quality of life they can get: for themselves and their children. If Los Angeles cannot provide that, perhaps other cities and regions can.
| Table 1 - Racial and Ethnic Structure of Los Angeles County, 2000-2010 | ||||||
| Population by Race and Ethnicity | 2000 | 2010 | Change 2000-2010 | % Changes 2000-2010 | ||
| Population | Percent | Population | Percent | |||
| Total | 9,519,338 | 100.0 | 9,818,605 | 100.0 | 299,267 | 3.1 |
| Not Hispanic or Latino | 5,275,851 | 55.4 | 5,130,716 | 52.3 | -145,135 | -2.8 |
| Not Hispanic or Latino; White alone | 2,946,145 | 30.9 | 2,728,321 | 27.8 | -217,824 | -7.4 |
| Not Hispanic or Latino; Black or African American alone | 891,194 | 9.4 | 815,086 | 8.3 | -76,108 | -8.5 |
| Not Hispanic or Latino; American Indian and Alaska Native alone | 26,141 | 0.3 | 18,886 | 0.2 | -7,255 | -27.8 |
| Not Hispanic or Latino; Asian alone | 1,123,964 | 11.8 | 1,325,671 | 13.5 | 201,707 | 17.9 |
| Not Hispanic or Latino; Native Hawaiian and Other Pacific Islander alone | 24,376 | 0.3 | 22,464 | 0.2 | -1,912 | -7.8 |
| Not Hispanic or Latino; Some other race alone | 18,859 | 0.2 | 25,367 | 0.3 | 6,508 | 34.5 |
| Not Hispanic or Latino; Two or more races | 245,172 | 2.6 | 194,921 | 2.0 | -50,251 | -20.5 |
| Hispanic or Latino | 4,243,487 | 44.6 | 4,687,889 | 47.7 | 444,402 | 10.5 |
| Hispanic or Latino; White alone | 1,676,614 | 17.6 | 2,208,178 | 22.5 | 531,564 | 31.7 |
| Hispanic or Latino; Black or African American alone | 25,713 | 0.3 | 41,788 | 0.4 | 16,075 | 62.5 |
| Hispanic or Latino; American Indian and Alaska Native alone | 42,330 | 0.4 | 53,942 | 0.5 | 11,612 | 27.4 |
| Hispanic or Latino; Asian alone | 10,299 | 0.1 | 21,194 | 0.2 | 10,895 | 105.8 |
| Hispanic or Latino; Native Hawaiian and Other Pacific Islander alone | 2,845 | 0.0 | 3,630 | 0.0 | 785 | 27.6 |
| Hispanic or Latino; Some other race alone | 2,244,066 | 23.6 | 2,115,265 | 21.5 | -128,801 | -5.7 |
| Hispanic or Latino; Two or more races | 241,620 | 2.5 | 243,792 | 2.5 | 2,172 | 0.9 |
| Source: U.S. Census Bureau, 2000 and 2010 | ||||||
| Table 2 - Foreign Born Population in Los Angeles County by Decade of Entry in the U.S. | ||
| Decade of entry | Population | Percent |
| Before 1950 | 24,568 | 0.7 |
| 1950-1959 | 67,127 | 1.9 |
| 1960-1969 | 182,618 | 5.2 |
| 1970-1979 | 569,689 | 16.3 |
| 1980-1989 | 934,034 | 26.7 |
| 1990-1999 | 909,692 | 26.0 |
| 2000-2009 | 811,808 | 23.2 |
| Total | 3,499,536 | 100 |
| Source: U.S. Census Bureau, American Community Survey, 2009 | ||
| Note: Selected Data is from PUMAs 4500 to 6126 | ||
| Table 3 - Race and Ethnicity among Native Born Population, by Age - Los Angeles County | ||||||
| Race and Ethnicity | 0 - 9 | 10-19 | 20-29 | |||
| Non-Hispanic | Latino | Non-Hispanic | Latino | Non-Hispanic | Latino | |
| White alone | 235,638 | 433,253 | 245,522 | 374,450 | 299,123 | 233,629 |
| African Americans | 97,213 | 4,494 | 115,954 | 3,908 | 116,017 | 4,569 |
| Native Americans | 2,010 | 5,093 | 1,930 | 5,102 | 4,179 | 3,720 |
| Asian | 106,150 | 2,007 | 98,866 | 2,413 | 76,293 | 2,094 |
| Pacific Islander | 2,806 | 150 | 4,262 | 479 | 3,141 | 155 |
| Other | 3,989 | 360,581 | 4,908 | 317,786 | 2,830 | 203,948 |
| Two ore more races | 44,079 | 33,447 | 31,733 | 30,319 | 28,443 | 19,189 |
| Total | 491,885 | 839,025 | 503,175 | 734,457 | 530,026 | 467,304 |
| Race and Ethnicity | 30-39 | 40-49 | 50-59 | |||
| Non-Hispanic | Latino | Non-Hispanic | Latino | Non-Hispanic | Latino | |
| White alone | 293,983 | 138,832 | 348,042 | 90,154 | 346,481 | 57,596 |
| African Americans | 97,312 | 2,297 | 116,845 | 1,065 | 99,881 | 816 |
| Native Americans | 2,180 | 2,557 | 2,371 | 1,872 | 4,205 | 2,249 |
| Asian | 39,582 | 1,992 | 22,476 | 772 | 20,151 | 515 |
| Pacific Islander | 3,740 | 354 | 2,149 | 157 | 1,556 | 57 |
| Other | 2,182 | 103,856 | 958 | 53,540 | 742 | 36,311 |
| Two ore more races | 20,435 | 11,770 | 13,319 | 7,022 | 10,131 | 4,695 |
| Total | 459,414 | 261,658 | 506,160 | 154,582 | 483,147 | 102,239 |
| Race and Ethnicity | 60+ | Total | Total | |||
| Non-Hispanic | Latino | Non-Hispanic | Latino | |||
| White alone | 522,510 | 80,945 | 2,291,299 | 1,408,859 | 1,821,615 | |
| African Americans | 124,587 | 1,011 | 767,809 | 18,160 | 342,155 | |
| Native Americans | 1,883 | 1,483 | 18,758 | 22,076 | 22,034 | |
| Asian | 32,665 | 845 | 396,183 | 10,638 | 287,823 | |
| Pacific Islander | 2,395 | 147 | 20,049 | 1,499 | 10,993 | |
| Other | 1,029 | 30,085 | 16,638 | 1,106,107 | 894,042 | |
| Two ore more races | 10,254 | 5,160 | 158,394 | 111,602 | 187,210 | |
| Total | 695,323 | 119,676 | 3,669,130 | 2,678,941 | 3,565,872 | |
| Source: U.S. Census Bureau, ACS 2009 | ||||||
| Table 4 - Average Age by Race and Ethnicity, Los Angeles County | |||||||||
| Race | Latino | Non-Hispanic | All | ||||||
| Average Age | Population | Std. Deviation | Average Age | Population | Std. Deviation | Average Age | Population | Std. Deviation | |
| White | 21.7 | 1,408,859 | 18.9 | 41.2 | 2,291,299 | 23.0 | 33.7 | 3,700,158 | 23.5 |
| African American | 23.2 | 18,160 | 18.0 | 36.2 | 767,809 | 22.1 | 35.9 | 785,969 | 22.1 |
| Native American | 26.6 | 22,076 | 20.0 | 36.3 | 18,758 | 20.1 | 31.1 | 40,834 | 20.6 |
| Asian | 26.9 | 10,638 | 19.0 | 24.2 | 396,183 | 20.8 | 24.2 | 406,821 | 20.8 |
| Pacific Islander | 28.5 | 1,499 | 18.7 | 31.2 | 20,049 | 19.8 | 31.0 | 21,548 | 19.7 |
| Other | 19.0 | 1,106,107 | 16.0 | 23.5 | 16,638 | 18.3 | 19.1 | 1,122,745 | 16.1 |
| Two or more races | 21.2 | 111,602 | 17.7 | 24.7 | 158,394 | 19.7 | 23.2 | 269,996 | 19.0 |
| All | 20.6 | 2,678,941 | 17.8 | 37.4 | 3,669,130 | 23.2 | 30.3 | 6,348,071 | 22.6 |
| Source: U.S. Census Bureau, ACS 2009 | |||||||||
| Table 5 - Age Composition and Changes from 2000 to 2010, Los Angeles County | ||||
| Age | 2000 | 2010 | Change | % Change |
| Under 5 years | 737,631 | 645,793 | -91,838 | -12.5 |
| 5 to 9 years | 802,047 | 633,690 | -168,357 | -21.0 |
| 10 to 14 years | 723,652 | 678,845 | -44,807 | -6.2 |
| 15 to 19 years | 683,466 | 753,630 | 70,164 | 10.3 |
| 20 to 24 years | 701,837 | 752,788 | 50,951 | 7.3 |
| 25 to 34 years | 1,581,722 | 1,475,731 | -105,991 | -6.7 |
| 35 to 44 years | 1,517,478 | 1,430,326 | -87,152 | -5.7 |
| 45 to 54 years | 1,148,612 | 1,368,947 | 220,335 | 19.2 |
| 55 to 59 years | 389,457 | 560,920 | 171,463 | 44.0 |
| 60 to 64 years | 306,763 | 452,236 | 145,473 | 47.4 |
| 65 to 74 years | 492,833 | 568,470 | 75,637 | 15.3 |
| 75 to 84 years | 324,693 | 345,603 | 20,910 | 6.4 |
| 85 years and over | 109,147 | 151,626 | 42,479 | 38.9 |
| Total | 9,519,338 | 9,818,605 | 299,267 | 3.1 |
| Source: U.S. Census Bureau, 2000 and 2010 | ||||
Ali Modarres is an urban geographer at California State University, Los Angeles. This report is based on a longer article appearing in the 2011 edition of the journal of California Politics and Policy.
Photo by Bigstockphoto.com


Great post! I am actually
Great post! I am actually getting ready to across this information, is very helpful my friend. Also great blog here with all of the valuable information you have. Keep up the good work you are doing here.
http://unlockherlegsdownload.com
This is a great inspiring
This is a great inspiring article.I am pretty much pleased with your good work.You put really very helpful information. Keep it up. Keep blogging. Looking to reading your next post.
http://www.rebelmouse.com/
Love to read it,Waiting For
Love to read it,Waiting For More new Update and I Already Read your Recent Post its Great Thanks.
http://memyfriends.com/
nice post, keep up with this
nice post, keep up with this interesting work. It really is good to know that this topic is being covered also on this web site so cheers for taking time to discuss this!
Victorino Noval Philanthropist
I recently found many useful
I recently found many useful information in your website especially this blog page. Among the lots of comments on your articles. Thanks for sharing.
so
Thanks for a wonderful
Thanks for a wonderful share. Your article has proved your hard work and experience you have got in this field. Brilliant .i love it reading.
gfas v2 examples
I am definitely enjoying
I am definitely enjoying your website. You definitely have some great insight and great stories.
how do you make a girl want to sleep with you
You know your projects stand
You know your projects stand out of the herd. There is something special about them. It seems to me all of them are really brilliant!
www.rebelmouse.com
Your music is amazing. You
Your music is amazing. You have some very talented artists. I wish you the best of success.
how to turn a girl on really fast
This is my first time i
This is my first time i visit here. I found so many interesting stuff in your blog especially its discussion. From the tons of comments on your articles, I guess I am not the only one having all the enjoyment here! keep up the good work
is it a scam