
The recent release of the 2010 US census data on urban areas (Note 1) shows that Americans continue to prefer their lower density lifestyles, with both suburbs and exurbs (Note 2) growing more rapidly than the historic core municipalities. This may appear to be at odds with the recent Census Bureau 2011 metropolitan area population estimates, which were widely mischaracterized as indicating exurban (and suburban) losses and historical core municipality gains. In fact, core counties lost domestic migrants, while suburban and exurban counties gained domestic migrants. The better performance of the core counties was caused by higher rates of international migration, more births in relation to deaths and an economic malaise that has people staying in (counties are the lowest level at which migration data is reported). Nonetheless, the improving environment of core cities in recent decades has been heartening.
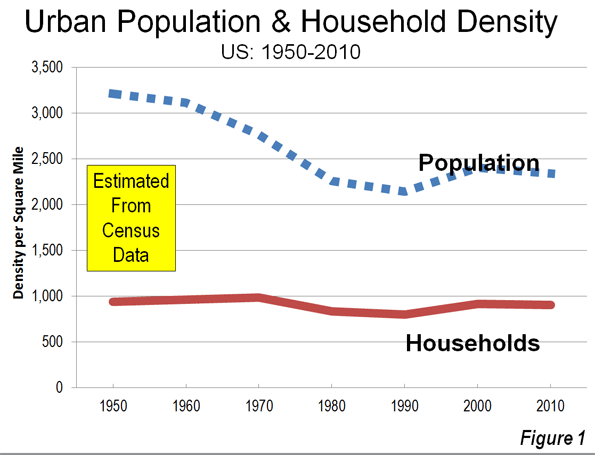
The urban area data permits analysis of metropolitan area population growth by sector at nearly the smallest census geography (census blocks, which are smaller than census tracts). Overall, the new data indicates that an average urban population density stands at 2,343 per square mile (904 per square kilometer). This is little different from urban density in 1980 and nearly 10 percent above the lowest urban density of 2,141 per square mile (827) recorded in the 1990 census. Thus, in recent decades, formerly falling US urban densities have stabilized .
Urban density in 2010, however, remains approximately 27 percent below that of 1950, as many core municipalities lost population while suburban and suburban populations expanded. This resulted in the substantial expansion of urban land area reflecting the preference for low-density lifestyles among Americans and most people in other high-income areas of the world. Between the 1960s and 2000, nearly all of the growth in the major metropolitan regions of Western Europe and Canada has taken place in suburban areas, as these nations’ urban areas have dispersed in a manner similar to that of the United States. The trend continued through 2011 in Canada and domestic migration data in Western Europe shows a continuing movement of people from the historical cores to the suburbs and exurbs.
This dispersion, pejoratively called "urban sprawl" has been routinely linked with everything from obesity and global warming to "bowling alone." In fact, while population densities have fallen, households densities have remained steady, barely droppping at all. Average household size has fallen dramatically, as fewer children have been born and divorce rates have soared. New households have been formed at more than 1.5 times the rate of population growth. The result is that a 27 percent decline in urban density since 1950 translated into a much more modest 4 percent decline in household density. A more genuine target for anti-suburban crusaders would be household sprawl rather than urban sprawl (Figure 1).
Smaller Urban Areas Growing Faster
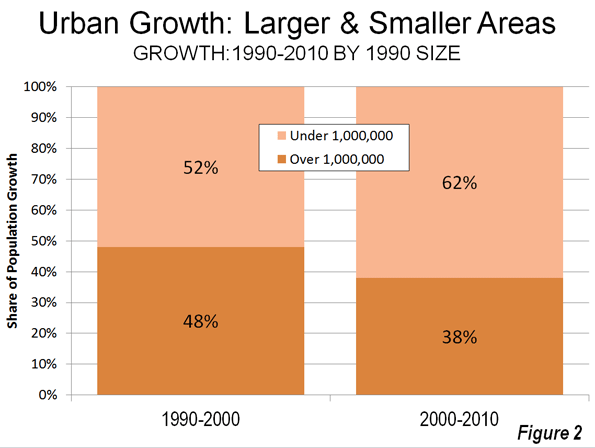
Even as urban densities have reached a floor, Americans still continue to move to areas of lower density and smaller populations. For example, the urban areas of more than 1 million population in 1990 attracted 48 percent of the nation's urban growth between 1990 and 2000. Between 2000 and 2010, these areas attracted a smaller 38 percent of urban growth (Figure 2).
The Exurbs: A Two-Way Exodus
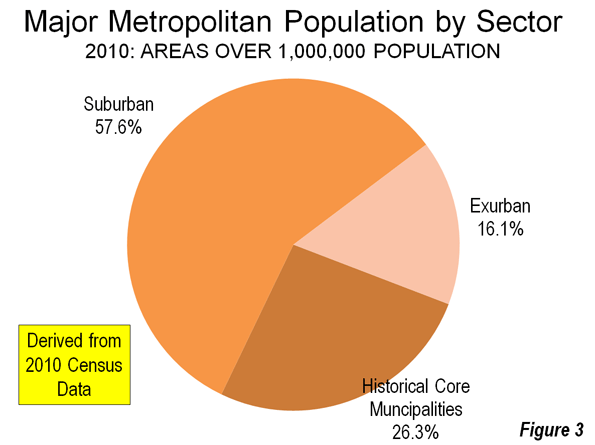
For much of the last decade (and even before), the media has been heralding an epochal “return” to core cities. This idea is fundamentally misleading since most suburbanites actually came not from core cities but smaller towns and rural areas. The census results have made it clear that the urban focus of population growth was largely anecdotal, although small inner city areas of some core cities (such as small sections of St. Louis, Chicago, Dallas, Seattle, San Diego and Portland) have experienced uncharacteristic growth. But overall, most growth continued to be in the suburbs and exurbs. Measured at the census block level, exurbs are constantly at risk of being converted into suburbs as they become a part of the continuously developed area. Even so, as of 2010, exurban areas accounted for 16.1 percent of the population in the 51 major metropolitan areas. The historical core municipalities accounted for 26.3 percent of the population, while suburban areas housed 57.6 percent of the population (Figure 3).
It should be considered, however, that in many urban areas --- such as Houston, Los Angeles, Phoenix, Portland, Seattle and Orlando --- many historic city neighborhoods were developed as and remain suburban in their form, being dominated detached homes and automobiles. It is unlikely that exurban areas (measured at the census block level) will exceed the historical core cities in population, since they are at constant risk of being merged with suburbs (as the urban area expands).
Smaller Urban Areas: Where the Sprawl Is
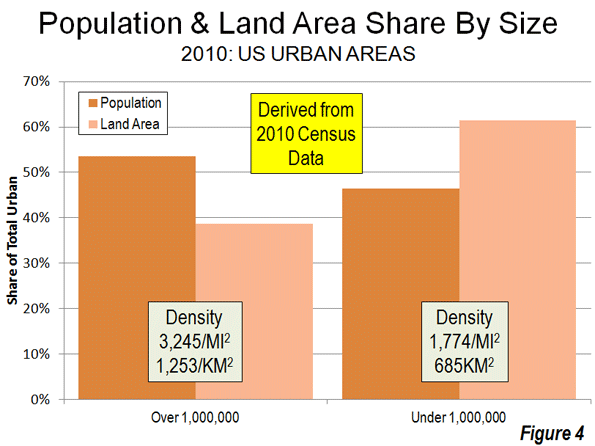
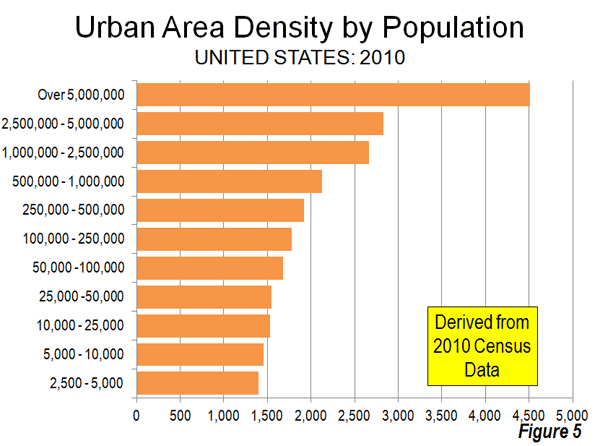
The principal urban areas of the major metropolitan areas are nearly twice as dense as the rest of America's urban areas. These urban areas have 53 percent of the urban population, but occupy only 39 percent of the urban land area. By contrast, the smaller urban areas have 47 percent of the urban population, while occupying 61 percent of the urban land area (Figure 4). It seems odd that the fury of urban planners is directed at the larger, more dense urban areas rather than the smaller, much less dense urban areas, that sprawl to a far greater degree (Figure 5).
Most and Least Dense Major Urban Areas
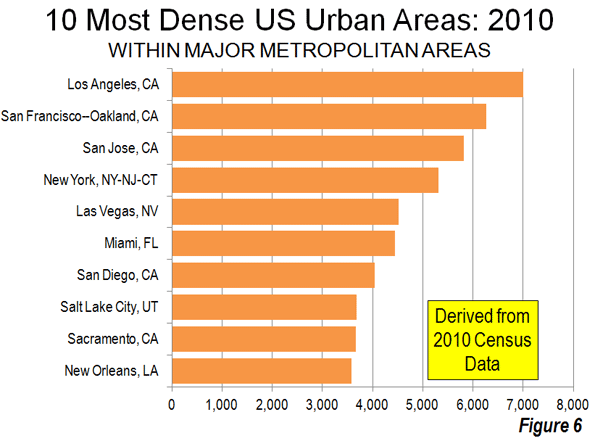
Among the major metropolitan areas, the most dense urban area is Los Angeles, at a density of 6,999 per square mile (2,702 per square kilometer). This is a 32 percent denser than fourth ranked New York whose hyper-dense core is offset by its low density suburbs. In fact, San Jose, which is virtually all suburban in its urban form and was a small urban area in 1950 (link to 1950-2010 data), ranks third and also is more dense than the New York urban area. Second ranked San Francisco is also more dense than New York (Figure 6). New Orleans ranked 10th most dense, however experienced a reduction in density of more approximately 30 percent due to the devastation of Hurricanes Katrina
It may be surprising that Portland, with by far the most radical densification policies in the nation, does not even rank among the 10 most dense urban areas. Portland ranked 13th, behind urban areas like Las Vegas, Salt Lake City, San Diego, Sacramento, Denver and exclusively suburban Riverside-San Bernardino (and even the much smaller urban areas of Fresno, Bakersfield, Turlock and Los Banos in California's San Joaquin Valley). However Portland did densify, reaching one-half the density of Los Angeles. Portland will catch Los Angeles in density by 2120 at the current rate.
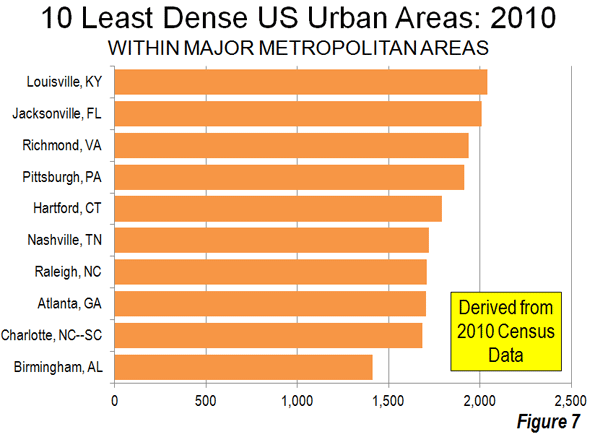
The least dense urban area is Birmingham, with a population density of 1,414 per square mile (546 per square kilometer). Atlanta, the least dense urban area of more than 3 million population in the world right is the third least dense at 1,707 per square mile (659 per square kilometer). The second least dense urban area, Charlotte, had a density of 1,685 per square mile (651 per square kilometer), while increasing its land area over the decade at twice the rate of Atlanta (Figure 7).
Staying the Same
Urbanization in the United States over the last decade can be characterized by the old French proverb that "the more things change the more they stay the same."
As in Europe and elsewhere (see the Evolving Urban Form series), when they move, Americans go to less dense areas such as to suburban and exurban areas within the larger metropolitan areas as well as smaller, lower density urban regions. The extent to which they move, however, will depend more upon economic improvement than the lure of core areas that, in reality, continue to lose younger people in their thirties while continuing not attracting their boomer parents as they get older.
Wendell Cox is a Visiting Professor, Conservatoire National des Arts et Metiers, Paris and the author of “War on the Dream: How Anti-Sprawl Policy Threatens the Quality of Life”
----
Note 1: Urban Areas and Metropolitan Areas: An urban area is the area of continuous development and as Sir Peter Hall put it, is thus the "physical" urban form. The urban area is a similar, but fundamentally different concept than a metropolitan area and analysts routinely confuse the terms. The United States Census Bureau calls urban areas over 50,000 population "urbanized areas." The metropolitan area is larger, and includes one or more urban areas as well as economically connected rural areas. . The metropolitan area is the "functional" urban form. There is no rural territory within urban areas, but there can be substantial rural territory in a metropolitan area (For example, the US defines metropolitan areas by counties. This can lead to artificially large metropolitan areas. For example, the Riverside San Bernardino metropolitan area, in the West where counties tend to be larger, covers 27,300 square miles (a land area larger than Ireland). The Cleveland metropolitan area, with a principal urban area similar in population to Riverside-San Bernardino, covers only 2,000 square miles, because it is located in Ohio, where counties are smaller. At the same, the far lower population density of the Riverside-San Bernardino metropolitan area is despite the fact that the urban area is approximately 50 percent more dense than the Cleveland urban area
Note 2: Historical Core Municipalities, Suburbs and Exurbs: For the purposes of this article, an area outside a historical core municipality is considered a suburb if it is in the urban area and an exurb if it is in the corresponding metropolitan area, but outside the principal urban area. Urban areas are delineated at a small census geographical area (the census block), which makes more precise analysis possible than is available at the county level, the lowest level at which domestic migration data is available.
Note 3: Principal Urban Areas: The principal urban area is the urban area within a metropolitan area that has the largest population. For example, in the Riverside-San Bernardino metropolitan area, the Riverside-San Bernardino urban area is the principal urban area. Other urban areas, such as Murrietta, Hemet and Indio (Palm Springs) would be secondary urban areas.
----
Photograph: Exurban St. Louis (photo by author)


