
There are grains of reality, misreporting and exaggeration in the press treatment of a report on driving trends by USPIRG. The report generated the usual press reports suggesting that the millennial generation (ages 16 to 35) is driving less, moving to urban cores, and that with a decline in driving per capita, people are switching to transit. These included the usual, but not representative anecdotes about people whose lifestyles and mobility needs are sufficiently served by the severe geographical and travel time limitations of transit.
Further, in an important contribution, the USPIRG report provides driving trend forecasts that are lower than other projections. If accurate, these would result in materially greater greenhouse gas emissions reductions to 2040 than projected by the Department of Energy, further undermining the justification for anti-mobility policies as well as urban containment.
Millennials and More Urban and Walkable Living
It is again reported that millennials "like to live in the city center." Last year, a report by USPIRG cited a poll indicating that 77 percent of millennials plan to live in urban cores. Their actual choices have been radically different.
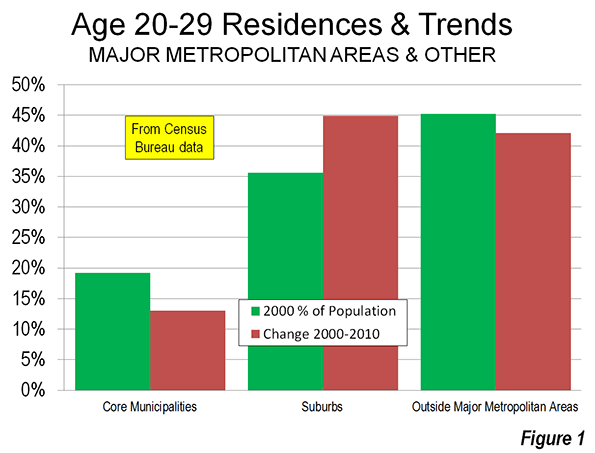
In fact, 2010 census data indicates that people between 20 and 29 years old were less inclined to live in more urban and walkable neighborhoods than their predecessors. In 2000, 19 percent of people aged 20 to 29 lived in the core municipalities of major metropolitan areas, where transit service and walkable neighborhoods are concentrated. Only 13 percent of the increase in 20 to 29-year-old population between 2000 and 2010 was in the core municipalities. By contrast, the share of the age 20 to 29 living in the suburbs of major metropolitan areas was 45 percent, higher than the 36 percent living there in 2000 (Figure 1).
The Decline in Driving
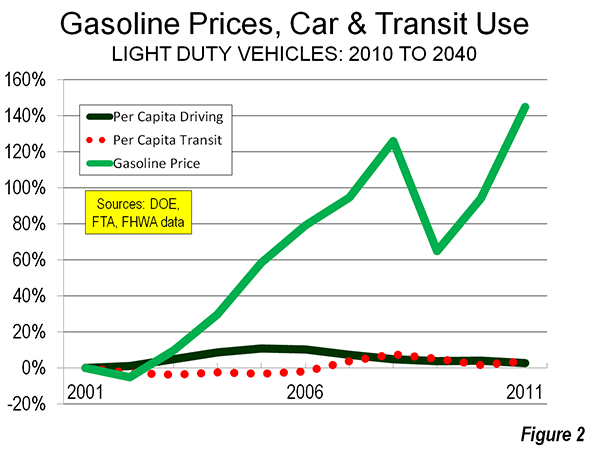
Driving per capita in urban areas peaked in 2005. Between 2005 and 2011, driving declined seven percent. In the context of rising gasoline prices, and economic trends, the real news is not how much driving has fallen, but rather how little. A seven percent reduction is slight compared to the one and one-half times increase in gas prices over the past decade (Figure 2). Per capita travel by car and light truck has fallen back only to 2002 levels, which remained above the driving rates of previous years.
Drivers: Not Switching to Transit
The USPIRG report gives the impression that instead of driving, Americans are switching to other modes of transport, principally transit. In discussing the report, Nick Turner, of the Rockefeller Foundation said: "Americans are making very different transportation choices than they did in years past."
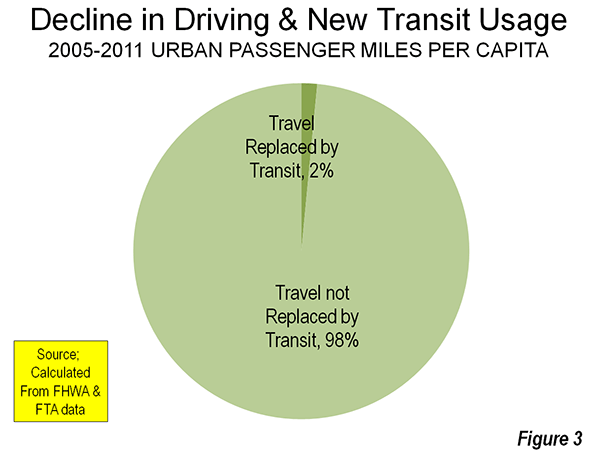
Actually not. The data shows that as people drove less, they did not switch to transit. The driving reduction was approximately 900 miles per capita from 2005 to 2011. At the same time, transit ridership per capita was up approximately 15 miles – a small change compared to the reduction in driving (Figure 3). People just traveled a less (perhaps fewer trips to the store or to the beach, not to mention the fewer work trips in a depressed economy).
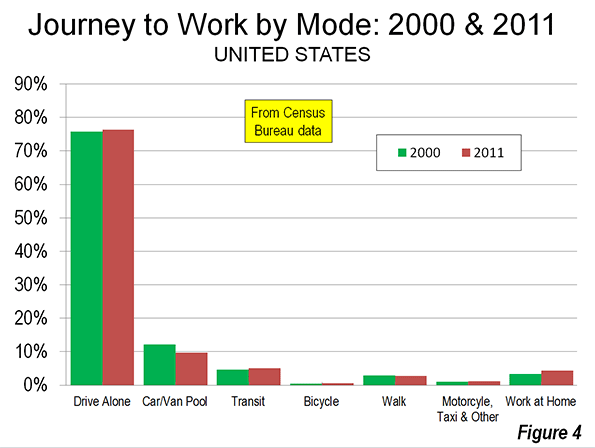
Work trip travel trends are little changed over the past decade. Driving alone and transit were up marginally between 2000 and 2011. Working at home increased the most, while car pooling declined the most (Figure 4).
This raises the issue of context. While driving was declining about seven percent per capita from 2005 to 2011, transit use was increasing about seven percent. The percentages were similar, but the amount of travel was radically different, because of transit’s much smaller base. Transit usage would need to increase nearly 400 percent to equal the mileage of a seven percent loss in travel by car. For all of the impressive transit ridership increase claims, transit's share of urban travel has changed little (Figure 5).
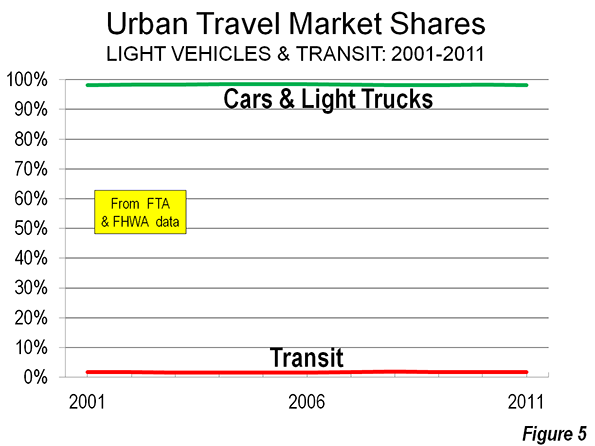
Transit's failure to capture much of the decline in driving simply reflects the limitation of its effectiveness in taking people where they need to go. Transit is very effective in providing mobility to the nation's largest downtown areas, where it provides half to three quarters of the trips. Approximately 55 percent of all US transit commuting is to six transit legacy cities (municipalities), including New York, Chicago, Philadelphia, Boston, San Francisco, and Washington. Most of this commuting is to the compact and dense downtown areas.
Outside the transit legacy cities, transit's impact is slight, because of the "last mile" problem. Transit service is not close enough (or fast enough) to be practical for most trips in metropolitan areas. For example, Brookings Institution data indicates that the average worker can reach fewer than 10 percent of of jobs in major metropolitan areas within 45 minutes. By contrast, the average solo driver reaches work in approximately 25 minutes. There is no solving this problem, because the infrastructure that would be required is far from affordable, as Professor Jean-Claude Ziv and I showed in a WCTRS paper (See: Megacities and Affluence).
Millennial Driving in Context
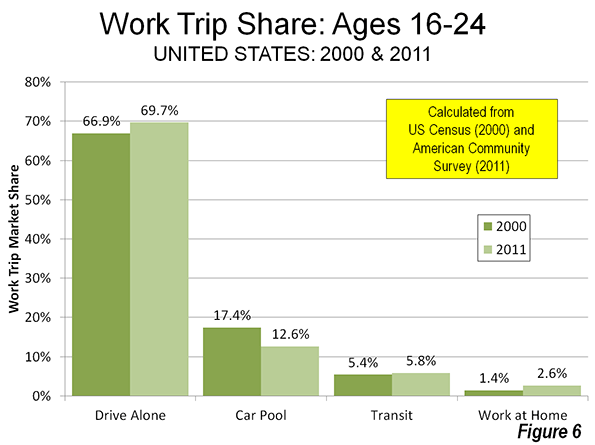
Survey data does indicate a decline in driving among millennials, but those with jobs are not flocking to transit. Single occupant commuting in this age group increased between 2000 and 2011, from 66.9 percent to 69.7 percent. Transit use and working at home also increased (5.4 percent to 5.8 percent and 1.4 percent to 2.6 percent respectively. There was, however, a substantial decline in car pool use among millennials, from 17.4 percent to 12.6 percent (Figure 6).
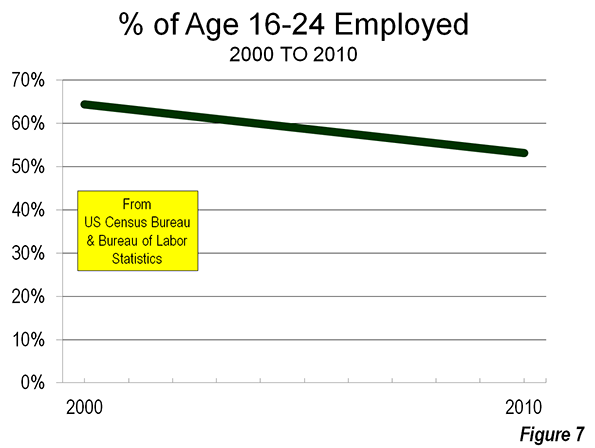
Younger workers have suffered disproportionately from the economic decline. There has been a substantial reduction in the percentage of people aged 16 to 24 who have jobs (Figure 7). These lost work trips have contributed more than any perceived preference for urban living to the decline in driving. Transportation expert Alan Pisarski has attributed much of the decline in demand in this age group to such economic factors.
At the same time, and as USPIRG indicates, the increase in social media use may well have contributed to the declining demand for discretionary travel.
Driving Less in the Future and the GHG Emissions Implications
The decline in per capita driving is not surprising. Back in 1999, Pisarski predicted that per capita driving would soon peak ("Cars, Women and Minorities: The Democratization of Mobility in America"), because automobile availability had now spread to most all segments of society.
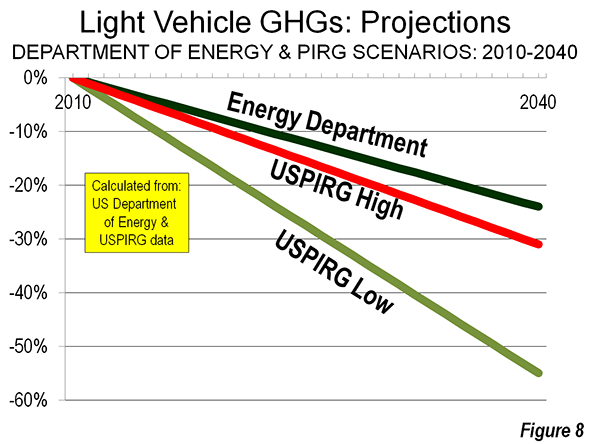
USPIRG forecasts driving volumes below US Department of Energy predictions. According to USPIRG: "Coupled with improvements in fuel efficiency, reduced driving means Americans will use about half as much gasoline and other fuels in 2040 than they use today." This means an even greater reduction in GHG emissions than currently forecast. Department of Energy forecasts a 21 percent decline in total (not per mile) GHG emissions from light vehicles between 2010 and 2040, despite a 40 percent increase in driving. The more modest driving levels in USPIRG scenarios would result in GHG emissions reductions of between 31 percent and 55 percent between 2010 and 2040 (Figure 8). These projections provide further evidence that of the "greening" of the automobile and the needlessness of urban containment policies.
Reality
Regardless, however, of the future trend, it is important to minimize the time that people spend traveling in metropolitan areas, because of the strong association between effective mobility, job access, and economic growth. Modern metropolitan areas require the quickest possible access between all origins and destinations to facilitate greater household affluence (measured in discretionary income) and lower levels of poverty. The objective should be the greatest reduction in travel delay per dollar spent on transportation.
Dug Begley accurately characterized the situation in the Houston Chronicle:
"We spend a lot of transportation money in the Houston region on roads, and for good reason: That’s how most people travel. Houston is a growing place, and there aren’t two or three job centers, there are about eight. Getting people between them ... is going to take roads."
Outside the municipal boundaries of the six legacy cities and especially their downtown enclaves, Houston (despite its reputation) is little different than the rest of metropolitan America. From the suburbs of New York, to the entire Portland and Phoenix metropolitan areas, the automobile carries the overwhelming share of travel (see Table 1, here). It cannot be any other way, since no planning agency in the New World or Western Europe has a plan, much less the resources, to construct a transit system that would duplicate the mobility of the automobile throughout its metropolitan area.
Wendell Cox is a Visiting Professor, Conservatoire National des Arts et Metiers, Paris and the author of “War on the Dream: How Anti-Sprawl Policy Threatens the Quality of Life.
-----
Methodology: This article is based on data from the Federal Highway Administration, the Federal Transit Administration, Census Bureau, Department of Energy and USPIRG.
Photo: Roadways, Fort Lauderdale (Miami metropolitan area)


Good day!
You have an exceptionally amazing written work style. Much obliged for offering. buy twitter favorites
I admit, I have not been on
I admit, I have not been on this web page in a long time... however it was another joy to see It is such an important topic and ignored by so many, even professionals. professionals. I thank you to help making people more aware of possible issues.
asking out a girl out of your league
it's really nice and
it's really nice and meanful. it's really cool blog. Linking is very useful thing.you have really helped lots of people who visit blog and provide them usefull information.
Web hosting
replace them
if a certain agency or organization is not perform well what we can do is replace the management or replace the agency
buy soundcloud comments
Nice and Impressive
The explanation is great
Well written and the charts makes the article more clearer
Informative and interesting
buy youtube comments
That is really nice to hear.
That is really nice to hear. thank you for the update and good luck.
techniques to get my ex boyfriend back
I have read your article, it
I have read your article, it is very informative and helpful for me.I admire the valuable information you offer in your articles. Thanks for posting it..
best way to seduce your man
You know your projects stand
You know your projects stand out of the herd. There is something special about them. It seems to me all of them are really brilliant!
why do guys you like ignore you
I enjoyed reading this
I enjoyed reading this article about Driving Trends. Knowing about driving trends would help car industry to meet the customer satisfaction. meet and greet luton is also following new driving trends to develop parking compounds.
great,.
Great article!, It's very informative and interesting to read. I also tried to Purchase Twitter Favorites and it was awesome. Thanks for sharing this post,.