
The United States labor market has been undergoing a substantial shift toward small-scale entrepreneurship. The number of proprietors – owners of businesses who are not wage and salary employees, has skyrocketed, especially in the last decade. Proprietors are self employed business owners who use Internal Revenue Service Schedule C to file their federal income tax. Wage and salary workers are all employees of any establishment (private or government), from executives to non-supervisory workers.
From 2000 to 2011, the number of non-farm proprietors grew by 10.7 million. Total wage and salary employment grew by only 105,000 between 2000 and 2011. Government employment, including federal, state and local, grew 1.36 million, while private employment declined by 1.26 million (Figure 1).
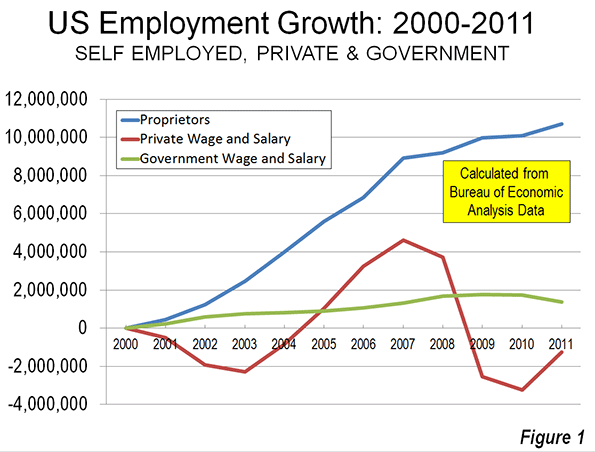
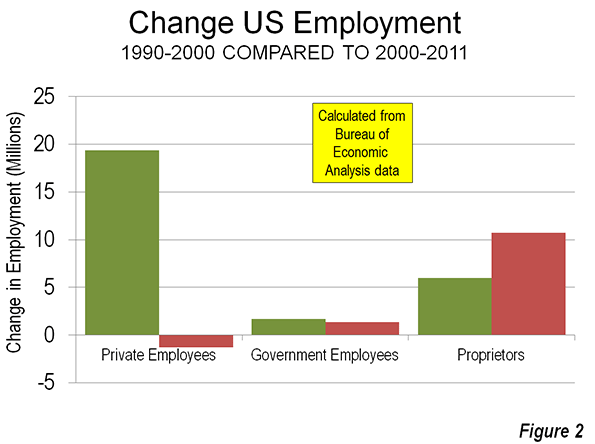
As a result, 99 percent of the total increase in employment from 2000 to 2011 was in the self-employed, according to Bureau of Economic Analysis of the United States Department of Commerce data. By comparison, during the 1990s, self employment accounted for only 22 percent of the increase in jobs nationally (Figure 2). The economic impact of the increase in self employment may be less, however, than its gross numbers, because many of the self employed are also engaged in wage and salary employment (Note).
Self Employment Gains in the Great Recession
Perhaps most striking is the fact that the number of entrepreneurs continued to grow in the Great Recession and what might be called the continuing Great Malaise. From 2007 to 2011, there was an increase of 1.8 million proprietors. This annual growth of nearly 450,000 was more modest than between 2000 and 2007, when the average number of proprietors grew 1.28 million, nearly three times as fast. The continuing growth in proprietors starkly contrasts with the loss of 5.9 million in private sector jobs. Government employment grew 44,000.
A Longer Term Trend
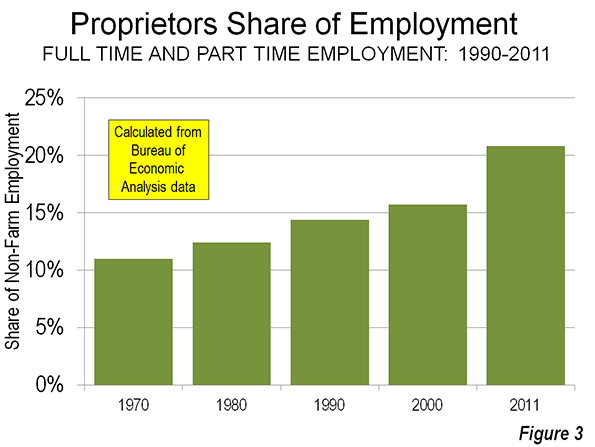
The data from 2000 to 2011 indicates an acceleration of an already developing trend of greater self employment, which can be traced back to at least 1970 (the earliest data readily available). In 1970, proprietors were 11.0 percent of employment, a figure that rose to 15.6 percent by 2000. The greatest increase occurred after 2000, when the number of proprietors increased 42 percent. In 2011, proprietors represented 21 percent of employment, nearly double their proportion in 1970 (Figure 3).
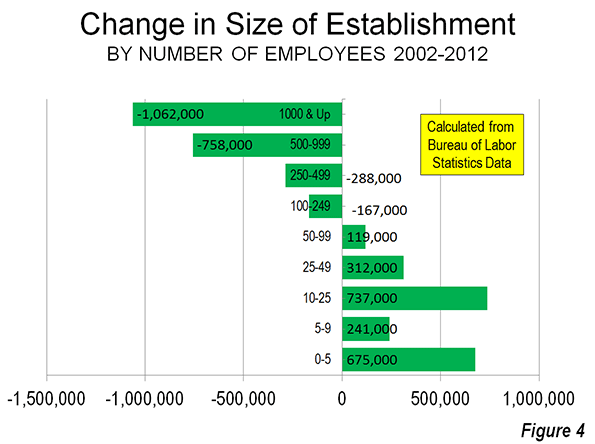
This increase in proprietors (and their generally smaller commercial establishments) tracks with the continuing decline in average establishment size (Figure 4). United States Bureau of Labor Statistics data shows that between 2002 and 2012, there was a loss of 2.3 million private jobs in establishments with 100 or more employees. Establishments with 500 or more employees experienced a reduction of 1.8 million jobs, 80 percent of the large establishment (100 and over) losses. These losses were nearly made up by gains in establishments with under 100 employees (2.1 million).
State Self Employment Trends
Self employment added the largest number of jobs in 40 states between 2000 and 2011 (Table). Its percentage increase exceeded both those of private and government employment in all but two states (North Dakota and Alaska)
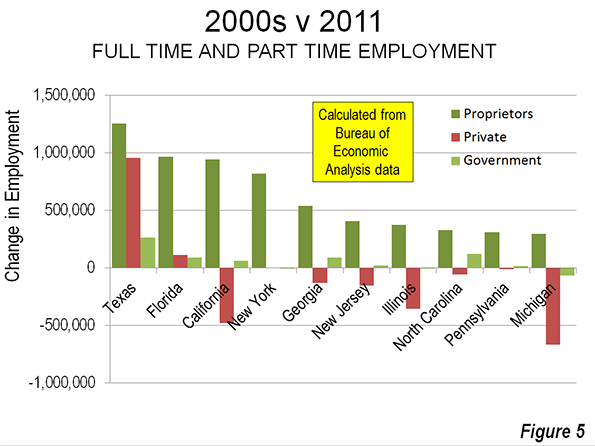
Texas added the largest number of proprietors between 2000 and 2011. The Lone Star state added 1.26 million proprietors. Florida ranked second, added 970,000 proprietors, followed by California with 940,000. New York with its long laggard economic growth , added 820,000 proprietors. Georgia ranked 5th, adding 540,000. The next five included fast growing North Carolina (8th), as well as slower growing New Jersey, Illinois, Pennsylvania and Michigan (yes, Michigan).
The story, however, was much different among these states in wage and salary employment. Texas, with the nation’s most vibrant and business friendly big state economy (according to chiefexecutive.net), added 1.22 million wage and salary jobs, 960,000 of which were in the private sector. Florida did somewhat worse, adding only 201,000 jobs, 113,000 in the private sector. California lost 480,000 private sector jobs, while adding 62,000 government jobs. Public and government employment changed little in New York. Georgia lost 131,000 private jobs, while adding 87,000 to government payrolls, while New Jersey and Illinois suffered private sector losses of 155,000 and 355,000 respectively (Figure 5 and Table).
| EMPLOYMENT CHANGE BY TYPE OF JOB: 2000-2011 | |||||
| Wage & Salary Employment | Total Employment | ||||
| Private | Government | Total | Proprietors | ||
| Alabama | (69,050) | 22,297 | (46,753) | 154,522 | 107,769 |
| Alaska | 39,839 | 12,355 | 52,194 | 9,621 | 61,815 |
| Arizona | 126,805 | 51,509 | 178,314 | 245,934 | 424,248 |
| Arkansas | (8,806) | 27,902 | 19,096 | 47,141 | 66,237 |
| California | (479,691) | 62,143 | (417,548) | 941,071 | 523,523 |
| Colorado | (8,740) | 70,077 | 61,337 | 209,084 | 270,421 |
| Connecticut | (64,857) | 3,022 | (61,835) | 168,636 | 106,801 |
| Delaware | (11,550) | 6,597 | (4,953) | 35,349 | 30,396 |
| District of Columbia | 46,402 | 27,180 | 73,582 | 29,288 | 102,870 |
| Florida | 113,353 | 88,063 | 201,416 | 968,006 | 1,169,422 |
| Georgia | (131,337) | 87,525 | (43,812) | 537,451 | 493,639 |
| Hawaii | 33,157 | 17,126 | 50,283 | 35,638 | 85,921 |
| Idaho | 37,459 | 8,327 | 45,786 | 54,325 | 100,111 |
| Illinois | (354,730) | (5,481) | (360,211) | 374,270 | 14,059 |
| Indiana | (180,865) | 18,415 | (162,450) | 105,068 | (57,382) |
| Iowa | 10,472 | 11,440 | 21,912 | 49,320 | 71,232 |
| Kansas | (17,794) | 21,022 | 3,228 | 74,747 | 77,975 |
| Kentucky | (48,771) | 39,826 | (8,945) | 86,259 | 77,314 |
| Louisiana | 8,380 | (16,543) | (8,163) | 219,700 | 211,537 |
| Maine | (11,858) | 1,060 | (10,798) | 23,994 | 13,196 |
| Maryland | 28,580 | 54,102 | 82,682 | 249,229 | 331,911 |
| Massachusetts | (96,684) | (4,699) | (101,383) | 211,607 | 110,224 |
| Michigan | (666,239) | (66,184) | (732,423) | 294,215 | (438,208) |
| Minnesota | (3,680) | 6,886 | 3,206 | 155,151 | 158,357 |
| Mississippi | (64,479) | 5,696 | (58,783) | 87,067 | 28,284 |
| Missouri | (107,603) | 12,903 | (94,700) | 138,189 | 43,489 |
| Montana | 38,149 | 7,163 | 45,312 | 31,068 | 76,380 |
| Nebraska | 15,922 | 12,470 | 28,392 | 42,849 | 71,241 |
| Nevada | 75,814 | 35,526 | 111,340 | 136,382 | 247,722 |
| New Hampshire | (7,892) | 9,275 | 1,383 | 41,525 | 42,908 |
| New Jersey | (155,108) | 21,622 | (133,486) | 405,353 | 271,867 |
| New Mexico | 48,017 | 11,506 | 59,523 | 37,120 | 96,643 |
| New York | 2,427 | (5,997) | (3,570) | 818,861 | 815,291 |
| North Carolina | (58,042) | 121,486 | 63,444 | 329,109 | 392,553 |
| North Dakota | 65,306 | 7,595 | 72,901 | 15,776 | 88,677 |
| Ohio | (514,436) | (5,380) | (519,816) | 277,931 | (241,885) |
| Oklahoma | 28,310 | 41,462 | 69,772 | 106,262 | 176,034 |
| Oregon | 19,047 | 16,878 | 35,925 | 95,406 | 131,331 |
| Pennsylvania | (11,087) | 17,678 | 6,591 | 310,306 | 316,897 |
| Rhode Island | (15,349) | (4,281) | (19,630) | 29,356 | 9,726 |
| South Carolina | (42,912) | 9,998 | (32,914) | 242,447 | 209,533 |
| South Dakota | 28,301 | 7,155 | 35,456 | 20,290 | 55,746 |
| Tennessee | (84,441) | 33,905 | (50,536) | 196,021 | 145,485 |
| Texas | 956,988 | 264,871 | 1,221,859 | 1,255,773 | 2,477,632 |
| Utah | 109,728 | 33,864 | 143,592 | 137,781 | 281,373 |
| Vermont | (4,419) | 4,179 | (240) | 21,467 | 21,227 |
| Virginia | 90,766 | 64,639 | 155,405 | 282,009 | 437,414 |
| Washington | 77,224 | 62,267 | 139,491 | 170,512 | 310,003 |
| West Virginia | 8,796 | 9,736 | 18,532 | 20,765 | 39,297 |
| Wisconsin | (81,794) | 13,783 | (68,011) | 148,572 | 80,561 |
| Wyoming | 33,972 | 10,034 | 44,006 | 21,077 | 65,083 |
| United States | (1,259,000) | 1,364,000 | 105,000 | 10,698,900 | 10,803,900 |
The Future?
Robert Fairlie, one of the nation’s leading experts on self-employment and a professor at the University of California, Santa Cruz, associates much of the increase in proprietors during the Great Recession to higher unemployment rates, measured at the local level. This is consistent with the rise in self employment during the Great Recession and the huge wage and salary job losses. At the same time, the larger increases in the decade before the Great Recession may indicate a strong underlying trend toward self employment. Certainly, this is supported by the rise of the Internet, which provides cheaper access to information and more comprehensive marketing opportunities.
The future could see stronger self employment gains. As the baby boom generation reaches retirement age, it is likely that many former employees will turn to self employment to increase their incomes.
Finally, the increasing global competitiveness could continue to reduce establishment sizes and encourage greater self employment. Stronger business regulation, including the mandates of the new medical care system ("Obamacare") could result in stunted employment growth, or even losses, forcing more people into self-employment even if they continue to work with current employers as contractors.
America may not become a "nation of shopkeepers," like 19th century Britain, but is increasingly becoming a self-employed nation. It will be challenging for governments, both at the national and local level to develop regulatory and tax structures that encourages this entrepreneurial expression, and perhaps more problematic, figure out to aid their conversion into larger businesses.
Wendell Cox is a Visiting Professor, Conservatoire National des Arts et Metiers, Paris and the author of “War on the Dream: How Anti-Sprawl Policy Threatens the Quality of Life.
----
Note: This article uses Bureau of Economic Analysis employment counts --- the number of jobs, rather than employees (an employee may have more than one job). The database in this analysis includes full and part time employment. Last year's Forbes article used a different database, limited to people who make their livings principally from self employment.


Hmm… I read blogs on a
Hmm… I read blogs on a similar topic, but i never visited your blog. I added it to favorites and i’ll be your constant reader.
wordpress directory theme
Easily, the article is
Easily, the article is actually the best topic on this registry related issue. I fit in with your conclusions and will eagerly look forward to your next updates. Just saying thanks will not just be sufficient, for the fantasti c lucidity in your writing. I will instantly grab your rss feed to stay informed of any updates.
http://familyselfdefencereviews.com
This is very educational
This is very educational content and written well for a change. It's nice to see that some people still understand how to write a quality post.!
SEO backlink
Thanks for writing such a
Thanks for writing such a good article, I stumbled onto your blog and read a few post. I like your style of writing...
Beijing air quality
I recently found many useful
I recently found many useful information in your website especially this blog page. Among the lots of comments on your articles. Thanks for sharing.
Edward Bass Producer
I have read your blog it is
I have read your blog it is very helpful for me. I want to say thanks to you. I have bookmark your site for future updates.
http://www.ebookreviews.ning.com/pdf/girlfriend-activation-system-review
It is a great website.. The
It is a great website.. The Design looks very good.. Keep working like that!.
megashare pretty little liars season 5 episode 23
Solo Entrepreneurs on the Rise
We took a thorough look at this trend in the recent Enterprising States report for the US Chamber of Commerce, subtitled Getting Down to Small Business. Below is an excerpt and here is the link; http://www.freeenterprise.com/enterprisingstates
The rate of new business creation has dipped recently and many more startup founders are flying solo as “jobless entrepreneurs,” choosing not to employ others. According to the Census Bureau, small business without payroll makes up more than 70 percent of America’s 27 million companies, with annual sales of $887 billion.
The virtual company model eschews employees since they, along with brick-and-mortar obligations, are viewed as costs that are not readily controllable and could create unnecessary legal exposure for a company. This contractor/consultant structure is particularly suited to early-stage startup-companies working on new technologies in need of high skill expertise.
Many solo entrepreneurs are not involved in technology-based ventures but want to forego the hiring headaches, managing problems, and added paperwork of running a business with employees. Oftentimes referred to as “free agents,“ lone eagles,” or “empires of one” these entrepreneurs can operate in a low-cost location such as the home office and can take advantage of outsourcing most functions while focusing on their core strengths.
The solo entrepreneur model is appealing to people leaving behind careers at big companies and for many retiring or downshifting baby boomers wanting to stay active but autonomous. The solo entrepreneur model is often considered to be primarily a lifestyle choice so it does not garner widespread interest or resources from the professional economic development community.
Texas, with the nation’s
Texas, with the nation’s most vibrant and business friendly big state economy . . .
I always shrink at the word vibrant. As a long-time self-employed person myself I will make two comments. First, like all business start-ups, sole proprietorships and partnerships fail more often than they succeed. Many people try them anyways because the alternatives are so poor. And second, many shady employers force their workers to work as sham private contractors as a way to skirt wage-and-hour laws. You need to correct for that.
Luke Lea
Low cost local economy is advantageous though
I do think it is true, though, that lower local costs (housing, taxes) lead to increased discretionary income in the local economy, and this effect compounds as money circulates.
Therefore, there is probably more opportunity, more startups, and a greater rate of survival of startups in a low-cost economy.