
New data from the National Household Survey indicates that driving to work continues to surge in Canada. In addition to providing work access market shares, the National Household Survey provides one-way work trip travel time estimates for all metropolitan areas.
The National Data
Between the 2006 census and the 2011 National Household Survey indicates an increase of nearly 750,000 additional work-bound cars on the road. The increase in driving exceeded the overall increase of 585,000 in employment (Figure 1). Transit also experienced a strong increase, adding nearly 230,000 one-way work trip riders. At the same time, there were declines in car pool passengers (266,100), walking and cycling (52,200), and working at home (87,700).
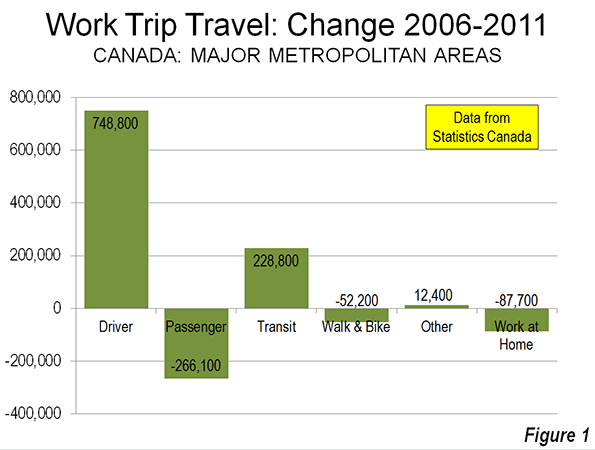
Driving (whether alone or in a car pool) reached a share of 68.9%, up 2.1 percentage points over the 66.8% registered in the 2006 census. Transit also increased, with its share rising from 10.2% in 2006 to 11.2% in 2011. The big loss was in carpool passengers which dropped from 7.1% to 5.9%. This declining carpool share mirrors the experience in the United States. There were also losses in the combined walking and cycling share, from 7.1% to 6.5% and in the work at home share from 7.7% to 6.9%.
Overall, the average one-way work trip travel time was 25.4 minutes, not much different than the US average of 25.5 minutes. However, among the major metropolitan areas, travel times generally exceeded those of similarly sized US metropolitan areas (below).
Major Metropolitan Areas
The story was similar among the major metropolitan areas (over 1,000,000 population).
Toronto: In Toronto, now Canada's dominant metropolitan area, driving (alone or in car pools) increased from 59.4% to 60.2% between 2006 and 2011. Transit also experienced a full one percentage point increase to 21.7%. This transit work trip market share is higher than any other metropolitan area in Canada or the United States, with the exception of New York, at 31.1%). Toronto’s transit market share trails that of Sydney slightly (22.2%), though is much higher than that in Melbourne. Driving and transit took virtually all of their increase from a 1.9 percentage point loss in carpool passengers.
Toronto’s one way work trip travel time was 32.8 minutes, which is longer than all other major metropolitan areas and exceeded in the New World only by Melbourne (36 minutes), New York (34.9 minutes), Washington (34.5 minutes), and Sydney (34 minutes). Toronto’s work trip travel time is longer than that of larger Los Angeles (28.6 minutes), as well as similarly-sized Dallas-Fort Worth (26.6 minutes) and Houston (27.7 minutes).
Montréal: Montréal, the nation's second-largest metropolitan area experienced a 1.2 percentage point increase in driving, while transit rose 0.7 percentage points. Montréal had the largest decline in carpool passengers among major metropolitan areas, falling from 4.7% in 2006 to 3.2% in 2011.
Montréal’s average one-way work trip travel time was 29.7 minutes, also longer than the Los Angeles metropolitan area, which has more than three times as many residents. Among the 12 US metropolitan areas between 2,500,000 and 5,000,000 population, only Baltimore (30.3) and Riverside-San Bernardino (31.0) have longer work trip travel times than Montréal.
Vancouver:Vancouver was the only major metropolitan area with the decline in driving, from 61.7% to 60.9%. Vancouver also had the highest transit market share increase, from 15.1% to 18.2%. Vancouver experienced a huge (1.9 percentage point) loss in carpool passengers and a strong loss in working at home (0.8 percentage points).
The average work trip travel time in Vancouver was 28.4 minutes. This is nearly equal to that of Los Angeles (28.6 minutes), despite the fact that Los Angeles is nearly five times as large. Vancouver, with a population of 2.3 million has a longer work trip travel time than any US major metropolitan area under 2,500,000 population.
Ottawa:Ottawa, which includes suburbs in Quebec (across the Ottawa River), experienced the 1.4 percentage point increase in driving and a 0.7% increase in transit use. Ottawa's transit market share ranks third in the nation. The driving and transit gains were also largely at the expense of carpool passenger and working at home losses. The one-way work trip travel time was 26.3 minutes.
Calgary:Among the major metropolitan areas, Calgary experienced the largest increase in driving, a 2.7 percentage point increase, from 64.2% to 66.9%. This is the second largest driver market share among the major metropolitan areas. Transit was up a modest 0.4 percentage points, while the share of carpool passengers dropped 1.9 percentage points. Working at home declined by 0.9 percentage points. The one-way work trip travel time was 27.0 minutes, longer than any US metropolitan area in the 1,000,000 to 2,500,000 population category.
Edmonton:Driving increased 2.1 percentage points from 2006 to 2011 in Edmonton, from 70.5% to 72.6%. Edmonton had the highest driver market share in the nation. Transit was up 1.6 percentage points. Car pool passengers declined 2.2 percentage points and working at home declined 0.7 percentage points. Edmonton’s one-way work trip travel time was 25.6 minutes, the shortest among the major metropolitan areas. Work trip travel in Edmonton takes somewhat longer than the average of 24.5 minutes for US metropolitan areas with from 1,000,000 to 2,500,000 million residents
Medium Sized Metropolitan Areas
Five of Canada’s metropolitan areas have between 400,000 and 1,000,000 residents (Quebec, Winnipeg, Hamilton, Kitchener and London). Overall, these areas experienced a 1.9 percentage point increase in driver market share, to 72.4%. Transit was up 0.6%age points to 9.3%. Driving and transit experienced market share gains in each of the five metropolitan areas. As among the major metropolitan areas, the driver and transit gains were principally from losses in car pool passengers. Work trip travel times were below the national average in all but Hamilton.
Travel Time by Mode
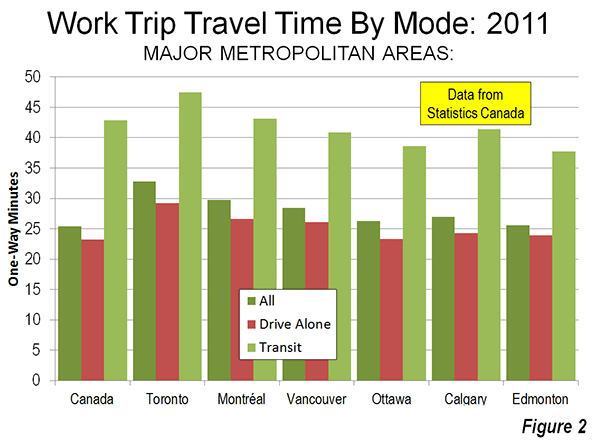
At the national level, automobile drivers had an average work trip of 23.2 minutes, while transit commuters spent nearly 20 minutes more (42.2 minutes). Transit’s relative travel times were better in the major metropolitan areas, all of which have rapid transit or light rail lines to downtown (25.6 minutes for solo drivers and 41.6 minutes for transit). Even so, the average transit commuter spends nearly two-thirds more time on the way to work than solo automobile commuters (Figure 2)
Transit’s Market Share
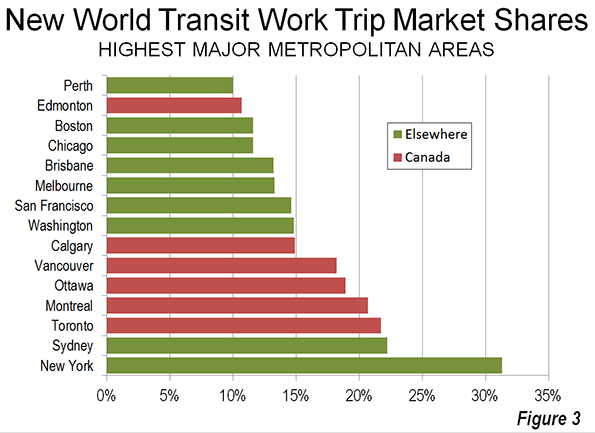
Among the six major metropolitan areas, five (Toronto, Montréal, Vancouver, Ottawa, and Calgary) have transit market shares greater than all other New World (Australia, Canada, New Zealand, and the United States) major metropolitan areas with the exception of New York and Sydney (Figure 3).
Policy Implications
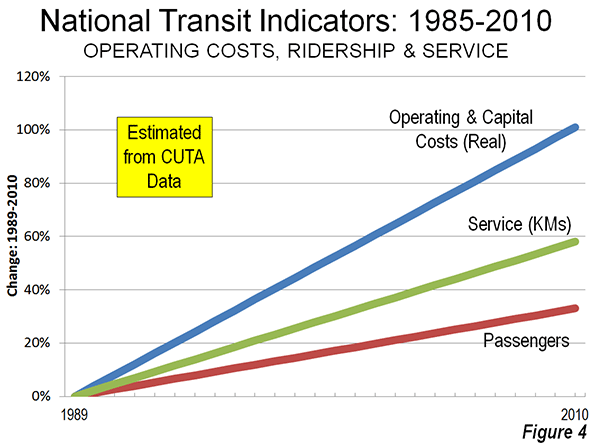
Major metropolitan areas in Canada have made substantial transit investments (see: Improving the Competitiveness of Metropolitan Areas) in recent years and have seen a strong escalation of operating subsidies (Figure 4). These expenditures did not prevent the substantial increase in driving. Transit’s increase was less than the decrease in car pool passengers. It is possible that many car pool passengers switched to transit, however any such diversion would not have had any impact on the number of cars on the road, but would have only reduced the number of passengers. Driving was up in all the major metropolitan areas, even Vancouver. This seems likely to have increased traffic congestion, which is already substantially worse in Canada than in the United States, though better than in Australia and New Zealand (Note).
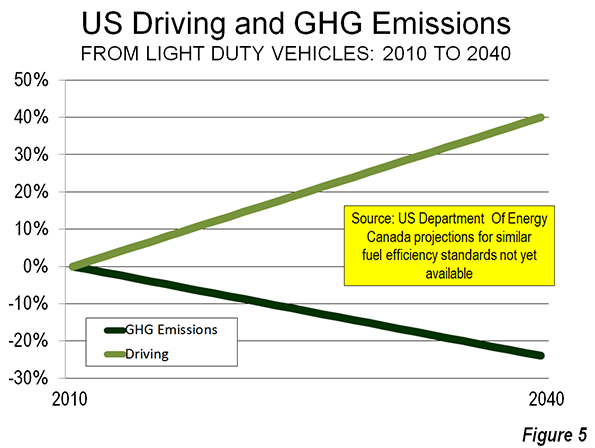
A principal reason for the increased transit investment has been to reduce greenhouse gas emissions (GHG emissions). However, that impetus is weakening. Canada is adopting strong vehicle emissions standards, virtually identical to the US regulations projected to lead to a huge GHG emissions reduction, even as driving volumes continue to increase (Figure 5). Similar progress seems likely in Canada (projections for Canada are not yet available).
| Table | ||||||
| Canada: Commuting Market Share: 2006-2011 | ||||||
| 2011: National Household Survey | Driver | Car Pool Passenger | Transit | Bike Or Walk | Other | Work at Home |
| Major Metropolitan Areas | ||||||
| Toronto, ON | 60.2% | 5.1% | 21.7% | 5.3% | 1.0% | 6.7% |
| Montréal, QC | 62.5% | 3.2% | 20.9% | 6.7% | 0.8% | 6.0% |
| Vancouver, BC | 60.9% | 4.6% | 18.2% | 7.5% | 1.3% | 7.6% |
| Ottawa, ON-QC | 60.0% | 6.3% | 18.9% | 8.0% | 0.9% | 5.8% |
| Calgary, AB | 66.9% | 5.1% | 14.9% | 5.7% | 1.3% | 6.2% |
| Edmonton, AB | 72.6% | 5.2% | 10.7% | 4.9% | 1.3% | 5.3% |
| Metropolitan Areas: 400,000-1M | ||||||
| Quebec, QC | 72.7% | 3.9% | 10.8% | 7.1% | 0.7% | 4.8% |
| Winnipeg, MB | 67.9% | 6.9% | 12.8% | 6.8% | 1.3% | 4.3% |
| Hamilton, ON | 73.0% | 6.2% | 8.7% | 5.0% | 0.9% | 6.2% |
| Kitchener, ON | 77.0% | 6.4% | 5.1% | 5.2% | 0.9% | 5.5% |
| London, ON | 73.4% | 6.3% | 6.4% | 6.4% | 0.8% | 6.6% |
| Major Metropolitan Areas | 62.5% | 4.6% | 19.3% | 6.2% | 1.0% | 6.4% |
| Metropolitan Areas: 400,000-1M | 72.4% | 5.8% | 9.3% | 6.2% | 0.9% | 5.3% |
| Balance of Canada | 75.3% | 5.8% | 2.8% | 7.0% | 1.4% | 7.8% |
| National Total | 68.9% | 5.2% | 11.2% | 6.5% | 1.2% | 6.9% |
| 2006: Census | Driver | Car Pool Passenger | Transit | Bike Or Walk | Other | Work at Home |
| Major Metropolitan Areas | ||||||
| Toronto, ON | 59.2% | 7.0% | 20.7% | 5.4% | 0.9% | 6.9% |
| Montréal, QC | 61.3% | 4.7% | 20.1% | 6.9% | 0.8% | 6.2% |
| Vancouver, BC | 61.7% | 6.5% | 15.1% | 7.3% | 1.1% | 8.4% |
| Ottawa, ON-QC | 58.6% | 7.5% | 18.2% | 8.3% | 0.8% | 6.6% |
| Calgary, AB | 64.2% | 7.0% | 14.5% | 6.2% | 1.0% | 7.1% |
| Edmonton, AB | 70.5% | 7.4% | 9.1% | 5.9% | 1.1% | 6.0% |
| Metropolitan Areas: 400,000-1M | ||||||
| Quebec, QC | 70.7% | 5.1% | 9.7% | 8.2% | 0.7% | 5.5% |
| Winnipeg, MB | 66.2% | 8.4% | 12.3% | 7.1% | 0.8% | 5.1% |
| Hamilton, ON | 71.4% | 8.0% | 8.2% | 5.5% | 0.8% | 6.2% |
| Kitchener, ON | 73.9% | 8.9% | 4.5% | 6.3% | 0.7% | 5.7% |
| London, ON | 70.7% | 8.5% | 6.3% | 7.2% | 0.9% | 6.4% |
| Major Metropolitan Areas | 61.4% | 6.4% | 18.1% | 6.4% | 0.9% | 6.8% |
| Metropolitan Areas: 400,000-1M | 70.3% | 7.6% | 8.7% | 6.9% | 0.8% | 5.7% |
| Balance of Canada | 71.6% | 7.7% | 2.3% | 7.9% | 1.4% | 9.1% |
| National Total | 66.8% | 7.1% | 10.2% | 7.1% | 1.1% | 7.7% |
| From Statistics Canada data | ||||||
Wendell Cox is a Visiting Professor, Conservatoire National des Arts et Metiers, Paris and the author of “War on the Dream: How Anti-Sprawl Policy Threatens the Quality of Life.
--------------------
Note: The INRIX Traffic Scorecard indicates that the average time lost in Canada’s traffic congestion was more than double the US rate (average delay of 15.6%, compared to 6.6% in the United States) in 2012. New data from Tom Tom indicates that traffic congestion is worse in Australia and New Zealand than in Canada.
Photo: Montreal Centre-Ville (downtown)


Pretty good post. I just
Pretty good post. I just stumbled upon your blog and wanted to say that I have really enjoyed reading your blog posts. Any way I'll be subscribing to your feed and I hope you post again soon. Big thanks for the useful info.
NITROvit
Your website is really cool
Your website is really cool and this is a great inspiring article.
rebelmouse.com
Great Information sharing ..
Great Information sharing .. I am very happy to read this article .. thanks for giving us go through info.Fantastic nice. I appreciate this post.
https://www.rebelmouse.com/the3weekdiet/
Thank goodness for TomTom
The inclusion of New Zealand in TomTom data has blown the cover on the abysmal state of transport "planning" in NZ. The bureaucrats have been running scared of getting any such analyses done, for a decade or more now.
It is also obvious that the correlation in the international data, is between low urban density and the primacy of road investment; and low traffic congestion delay. There is even a correlation between transit mode share and HIGHER traffic congestion delays, sufficient to negate any seeming advantage from the use of transit. But breaking through the misconceptions and the outright propaganda is difficult even with the facts and reason on your side.