
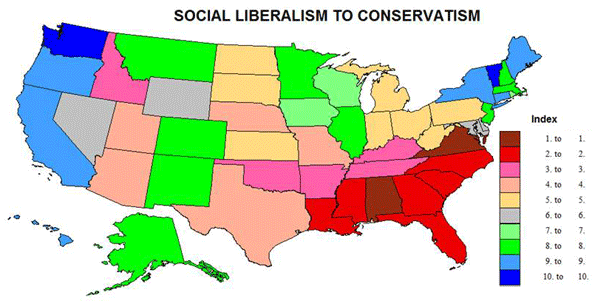
The cultural and political division of America, the gap between “red” and ”blue” with respect to economic and social liberalism or conservatism is a constant and dominant theme in American discourse. Here’s some narrowly specific measures of social liberalism based on actual votes by citizens or legislatures, not polls or broader indices available.
We would have liked to use more measures, but data problems restricted us to only 8 measures: women’s suffrage and state votes on the ERA (Equal Rights Amendment), the right to die, the legalization of marijuana, gay sex (sodomy laws), same sex marriage, racial intermarriage, contraception, and abortion (current state). Data for religion-state separation were inadequate, although we include some extra data on religiosity.
For women’s suffrage our index notes when suffrage was granted (states which did not until after the 19th Amendment get the lowest score). Similarly for the ERA, we give high scores to states which early granted rights to women, with low scores for states which did not pass the ERA, or rescinded an earlier yes vote. For racial intermarriage, scores were based on when intermarriage became legal, with the lowest scores for those states where it was still illegal before the 1967 Supreme Court decision. Gay sex similarly gives lowest scores with anti-sodomy laws still in force at the time of the Lawrence vs Texas case in 2003. The same sex marriage measure gives high scores to states which now accept same sex marriage. The contraception measure is based on current restrictions on emergency contraception, as data on earlier history were poor. The “right to die” or “death with dignity” cause is more recent. The abortion measure is based on a state by state analysis of when and if it was accepted by states before Roe, and the degree of current constraints. Finally the marijuana measure considers the vote in CO and WA, and also states with medical marijuana provisions.
These nine values are summed to give a score to the states (listed in table 1 below). The table is arranged in order from the lowest total (most conservative) to the highest (most liberal).
This scaling is compared to the right in the table with a measure of religiosity, two indices of social liberalism from the web (also published) and the Gallup poll. Since the data on the 9 measures and for the other indices were in varying units, I converted all to a simple scale from 1 (extremely conservative) to 10 (extremely liberal). The Gallup poll was for 2010-2012 surveys, the “religiosity” ranking on a separate Gallup poll on the “importance of religion,” the “Free state liberal” index is from the Free State Project Forum, State Policy Liberalism Rankings, by Jason Sorens , the social science model rankings from Andrew Gelman , Statistical modeling, causal inference and social science statistics, and based on the 2000 Annenberg Survey.
Since our analysis was based on varying measures, some quite recent and others quite old, our numbers are rather different from most of the other comparison indices. These are broadly similar to contemporary rankings of conservatism or liberalism, with some intriguing differences, which reflect our choice of measures.
Consider our low ranking of Virginia and Florida, which actually voted for Obama in 2008 and 2012! The reason is not that there is a dearth of liberals, but that they have not been very effective. If the state legislatures and courts don’t pass “liberal” measures because they are consistently controlled by conservative tradition and majorities, then many liberal voters are ineffective and irrelevant, except for statewide votes for senate or governor or president. The same principle applies to a lesser extent to Pennsylvania, Ohio, Michigan, and perhaps even Wisconsin. At the opposite end, there are many conservative voters in states like Washington, Oregon, Maine, California, New York and Vermont, but their effectiveness is low, since the governor and legislatures are often controlled by more liberal majorities. Washington may be the extreme in this respect, where the voters themselves, not the legislatures, twice affirmed abortion rights, then the right to same sex marriage, death with dignity (right to die), and the legalization of marijuana. Maine and Minnesota affirmed same sex marriage, and Oregon the right to die.
The relatively low ranking for the District of Columbia, often the most liberal in other surveys, probably reflects the fact that it was part of the South culturally and perhaps more importantly subject to congressional oversight.
The story is different for the states which are widely proclaimed to be conservative, but are in the lower “liberal” part of my table. Most noteworthy is Montana, but also Arkansas, Iowa, New Mexico, and Wyoming, noted among the most conservative in polls and other rankings. The reason again is my particular choice of measures. Western conservative states tend to embrace a libertarian point of view which can translate into social liberalism despite economic conservatism. Wyoming and then Montana were the first to give women the right to vote, and supported the ERA early on. Montana was the 3rd state to recognize a right to die; it also tried to defy the Supreme Court with respect to corporate political contributions (Citizens United).
The other main reason for difference is that my ranking is based solely on social issues, while the other ranking all have some degree of economic liberalism affecting their results. This is why many Northeastern states are lower in my more strictly social liberalism ranking. The data show that some states have become more liberal over time while some states in the wide open west have become more conservative (WY, NV, ID AZ).
The social geography of American states is a fascinating story of tradition and consistency, selective change. The deeper South (not DE and MD) remains astoundingly monolithic. It is hard to escape the conclusion that to many the Civil War is not over, that race still rules, but also that for less obvious reasons, more fundamentalist religious denominations dominate, while in much of the country, religious adherence has diminished.
At the other extreme, the “Left coast” and the Megalopolitan Northeast, (except for Pennsylvania!) exhibit a remarkable social liberalism. While the root may lie in a New England moralist or ethical tradition of tolerance, associated with the Congregational and Episcopal churches, this somehow became amplified in the 1960s and since through rising levels of education, professional occupations, and societal experimentation. To some degree this relatively liberal ideology moved westward across the “northern tier” to the rise of a “progressive” movement in the Great Lakes states, and on to Iowa and Minnesota, (still apparent!) and even on to Washington and Oregon.
The Mountain states, including probably Alaska, are more complex, with increasing conservatism, especially in the “Mormon realm” – Utah, Idaho, Arizona, and Wyoming, while New Mexico and Colorado have even become more liberal. Education? I’ll leave the explanation to the readers!
This leaves the great Midwestern heartland – the Great Lakes, the northern Plains, and Appalachia. Appalachia was Democratic, a legacy of mining and unions, but social change seemed to pass the region by, as historic forces of fundamentalist religion and traditional values and small-townness, resisted the social change associated with the large metropolis.
The Great Lakes states (MI, OH, IN, WI, IL) are remarkably alike in the middle ground between liberal and conservative on the social dimension, and seem to defy any simple understanding. They are metropolitan, and historically industrially vibrant, but also retain extensive small-town and farming areas, with a stronger religious tradition than the Left Coast or the megalopolitan realm. Thus they are resistant to the more ‘radical’ social changes, like same sex marriage. And Illinois just changed on same sex marriage! Other states may soon follow.
The northern Plains, the region from MO and KS to the Dakotas and Minnesota, is more socially diverse, with Minnesota and Iowa far more socially liberal than the other states, especially the less metropolitan western area from Kansas through the Dakotas.
I would conclude with a warning that this ranking is social, and ignores economic values and votes. Thus while WA maybe the most socially liberal, it is much lower on economic measures. While WA does have the highest minimum wage, it is 50th, yes last, in its regressive tax structure.
| Table 1: Index of Social Liberalism by State | ||||||||||
| State | Women Vote | Equal Rights Act | Racial Intermarry | Gay Sex | Same Sex Marriage | Contraception | Right to Die | Abortion | Marijuana | Total Score |
| AL | 1 | 1 | 1 | 1 | 1 | 1 | 1 | 1 | 1 | 9 |
| VA | 1 | 1 | 1 | 1 | 1 | 1 | 1 | 1 | 1 | 9 |
| MS | 3 | 1 | 1 | 1 | 2 | 1 | 1 | 1 | 1 | 12 |
| FL | 2 | 4 | 1 | 1 | 1 | 1 | 1 | 1 | 1 | 13 |
| GA | 2 | 1 | 1 | 3 | 1 | 1 | 1 | 3 | 1 | 14 |
| LA | 3 | 4 | 1 | 1 | 1 | 1 | 1 | 1 | 1 | 14 |
| NC | 1 | 4 | 1 | 1 | 1 | 1 | 1 | 4 | 1 | 15 |
| SC | 1 | 4 | 1 | 1 | 1 | 8 | 1 | 1 | 1 | 19 |
| OK | 9 | 4 | 1 | 1 | 1 | 1 | 1 | 1 | 1 | 20 |
| AR | 5 | 1 | 1 | 3 | 1 | 7 | 1 | 1 | 1 | 21 |
| KY | 6 | 4 | 1 | 5 | 1 | 1 | 1 | 1 | 1 | 21 |
| ID | 9 | 4 | 4 | 1 | 1 | 1 | 1 | 1 | 1 | 23 |
| TN | 5 | 4 | 1 | 5 | 2 | 1 | 1 | 3 | 1 | 23 |
| MO | 6 | 9 | 1 | 2 | 2 | 1 | 1 | 1 | 1 | 24 |
| NE | 5 | 4 | 4 | 8 | 1 | 1 | 1 | 1 | 1 | 26 |
| UT | 9 | 1 | 4 | 1 | 1 | 8 | 1 | 1 | 1 | 27 |
| TX | 5 | 9 | 1 | 1 | 1 | 7 | 1 | 1 | 1 | 27 |
| AZ | 9 | 1 | 4 | 3 | 2 | 1 | 1 | 3 | 5 | 29 |
| SD | 9 | 4 | 4 | 8 | 1 | 1 | 1 | 1 | 1 | 30 |
| KS | 9 | 9 | 7 | 1 | 1 | 1 | 1 | 1 | 1 | 31 |
| ND | 5 | 9 | 4 | 8 | 1 | 1 | 1 | 1 | 1 | 31 |
| WV | 1 | 9 | 1 | 8 | 4 | 1 | 1 | 7 | 1 | 33 |
| IN | 6 | 9 | 4 | 8 | 3 | 1 | 1 | 1 | 1 | 34 |
| MI | 9 | 9 | 7 | 1 | 1 | 1 | 1 | 1 | 5 | 35 |
| PA | 1 | 9 | 7 | 6 | 3 | 7 | 1 | 1 | 1 | 36 |
| OH | 4 | 9 | 7 | 8 | 1 | 7 | 1 | 1 | 1 | 39 |
| WY | 10 | 9 | 4 | 8 | 3 | 1 | 1 | 4 | 1 | 41 |
| DC | 5 | 9 | 4 | 6 | 9 | 7 | 1 | 1 | 1 | 43 |
| DE | 3 | 9 | 1 | 8 | 9 | 1 | 1 | 6 | 5 | 43 |
| MD | 1 | 9 | 4 | 4 | 10 | 1 | 1 | 9 | 4 | 43 |
| NV | 9 | 4 | 4 | 5 | 5 | 1 | 1 | 9 | 5 | 43 |
| RI | 6 | 9 | 7 | 5 | 9 | 1 | 1 | 4 | 5 | 47 |
| WI | 6 | 10 | 9 | 6 | 3 | 8 | 1 | 4 | 1 | 48 |
| IA | 6 | 9 | 7 | 8 | 9 | 1 | 1 | 6 | 1 | 48 |
| MT | 10 | 9 | 4 | 4 | 2 | 1 | 8 | 9 | 5 | 52 |
| IL | 5 | 4 | 7 | 10 | 9 | 8 | 1 | 7 | 1 | 52 |
| MA | 3 | 9 | 7 | 7 | 9 | 9 | 1 | 7 | 1 | 53 |
| NH | 3 | 9 | 9 | 8 | 9 | 9 | 1 | 7 | 1 | 56 |
| MN | 6 | 9 | 9 | 3 | 9 | 8 | 1 | 6 | 5 | 56 |
| NM | 3 | 9 | 7 | 8 | 7 | 9 | 1 | 9 | 5 | 58 |
| AK | 9 | 9 | 9 | 6 | 2 | 9 | 1 | 9 | 5 | 59 |
| NJ | 3 | 9 | 9 | 8 | 7 | 8 | 1 | 9 | 5 | 59 |
| CO | 9 | 9 | 4 | 8 | 5 | 7 | 1 | 6 | 10 | 59 |
| CT | 3 | 9 | 9 | 8 | 9 | 8 | 1 | 8 | 5 | 60 |
| HI | 5 | 9 | 9 | 8 | 5 | 9 | 1 | 10 | 5 | 61 |
| NY | 9 | 9 | 9 | 6 | 9 | 8 | 1 | 9 | 1 | 61 |
| CA | 9 | 9 | 4 | 8 | 9 | 9 | 1 | 9 | 5 | 63 |
| ME | 6 | 9 | 7 | 8 | 10 | 9 | 1 | 9 | 5 | 64 |
| OR | 9 | 9 | 4 | 8 | 5 | 8 | 10 | 9 | 5 | 67 |
| VT | 3 | 9 | 9 | 8 | 9 | 9 | 9 | 9 | 5 | 70 |
| WA | 9 | 9 | 7 | 8 | 10 | 9 | 9 | 10 | 10 | 81 |
| Table 2: Comparison to Other Indexes | |||||
| State | Religious Separation | Freestate Liberal | Socsci model rank | Gallup | My Ranking |
| AL | 1 | 1 | 3 | 1 | 1 |
| VA | 3 | 3 | 5 | 5 | 1 |
| MS | 1 | 1 | 1 | 1 | 2 |
| FL | 4 | 6 | 4 | 5 | 2 |
| GA | 2 | 2 | 3 | 3 | 2 |
| LA | 1 | 3 | 2 | 2 | 2 |
| NC | 2 | 4 | 4 | 4 | 2 |
| SC | 1 | 2 | 3 | 3 | 2 |
| OK | 1 | 1 | 2 | 2 | 3 |
| AR | 1 | 1 | 1 | 2 | 2 |
| KY | 2 | 2 | 1 | 4 | 3 |
| ID | 8 | 2 | 2 | 2 | 3 |
| TN | 2 | 1 | 2 | 3 | 3 |
| MO | 3 | 2 | 3 | 4 | 4 |
| NE | 4 | 3 | 3 | 2 | 4 |
| UT | 3 | 2 | 3 | 1 | 4 |
| TX | 2 | 1 | 3 | 4 | 4 |
| AZ | 7 | 4 | 4 | 4 | 4 |
| SD | 3 | 2 | 2 | 4 | 5 |
| KS | 3 | 2 | 4 | 4 | 5 |
| ND | 3 | 1 | 3 | 1 | 5 |
| WV | 3 | 4 | 1 | 3 | 5 |
| IN | 3 | 2 | 3 | 3 | 5 |
| MI | 5 | 6 | 5 | 7 | 5 |
| PA | 4 | 5 | 5 | 6.7 | 5 |
| OH | 4 | 7 | 4 | 5 | 5 |
| WY | 7 | 1 | 3 | 1 | 6 |
| DC | 6 | 5 | 9 | 10 | 6 |
| DE | 6 | 7 | 7 | 9 | 6 |
| MD | 4 | 9 | 7 | 6 | 6 |
| NV | 9 | 5 | 4 | 7 | 6 |
| RI | 9 | 8 | 10 | 9 | 7 |
| WI | 3 | 5 | 5 | 4 | 7 |
| IA | 5 | 4 | 5 | 4 | 7 |
| MT | 6 | 5 | 3 | 3 | 8 |
| IL | 6 | 7 | 6 | 6 | 8 |
| MA | 9 | 10 | 10 | 9 | 8 |
| NH | 10 | 6 | 7 | 7.8 | 8 |
| MN | 5 | 6 | 6 | 6 | 8 |
| NM | 4 | 4 | 4 | 7 | 8 |
| AK | 9 | 5 | 6 | 1 | 8 |
| NJ | 7 | 10 | 8 | 6 | 8 |
| CO | 7 | 6 | 5 | 7 | 8 |
| CT | 9 | 8 | 9 | 9 | 9 |
| HI | 8 | 8 | 7 | 8 | 9 |
| NY | 8 | 10 | 9 | 8 | 9 |
| CA | 8 | 9 | 7 | 6 | 9 |
| ME | 10 | 7 | 6 | 7.5 | 9 |
| OR | 9 | 7 | 7 | 9 | 9 |
| VT | 10 | 7 | 10 | 9 | 9 |
| WA | 9 | 7 | 6 | 5 | 10 |
| Correlation with My Ranking | 0.83 | 0.74 | 0.68 | 0.66 | |
Richard Morrill is Professor Emeritus of Geography and Environmental Studies, University of Washington. His research interests include: political geography (voting behavior, redistricting, local governance), population/demography/settlement/migration, urban geography and planning, urban transportation (i.e., old fashioned generalist).


