
The 2013 annual metropolitan area population estimates by the US Census Bureau indicate a continuing and persistent dominance of population growth and domestic migration by the South. Between 2010 and 2013, 51 percent of the population increase in the 52 major metropolitan areas (over 1 million population) was in the South. The West accounted for 30 percent of the increase, followed by the Northeast at 11 percent and eight percent in the North Central (Midwest).
Components of Population Change: Major Metropolitan Areas
The dominance of the South was even greater when we turn to net domestic migration between Census Bureau regions. Nearly 785,000 more people moved to the major metropolitan areas of the South from other parts of the country than left. A much smaller 170,000 net domestic migrants moved to major metropolitan areas in the West. At the same time the Northeast lost 485,000 net domestic migrants and the Midwest lost 280,000.
Perhaps even more remarkable, the South, long a laggard as an immigrant destination, even led in net international migration (666,000 for a 1.2 percent over three years), though the Northeast added 546,000, for a 1.0 percent rate). Net international migration to the West was about the same, some 454,000 for a 1.0 percent rate. The Midwest had the lowest net international migration in the country and well below any other region (280,000, for a 0.6 percent rate), as is indicated in Table 1.
There was a substantial gap in the natural increase (births minus deaths) between the regions as well. The West (2.1 percent relative to the 2010 population over the three years) lead the South (2.0 percent) slightly in rate. Both were well ahead of the Midwest at 1.5 percent and especially the Northeast, at 1.2 percent (Table 1).
| Table 1 | ||||
| Components of Population Change by Region | ||||
| Major Metropolitan Areas | ||||
| Total | Natural Growth (Births Minus Deaths) | Net Domestic Migration | Net International Migration | |
| Northeast | 546,742 | 434,872 | (434,029) | 545,899 |
| South | 2,555,304 | 1,105,631 | 783,438 | 666,235 |
| North Central | 398,536 | 472,017 | (280,022) | 206,541 |
| West | 1,543,319 | 917,852 | 171,444 | 454,023 |
| Change Compared to 2010 Population | ||||
| Northeast | 1.5% | 1.2% | -1.2% | 1.5% |
| South | 4.6% | 2.0% | 1.4% | 1.2% |
| North Central | 1.2% | 1.5% | -0.9% | 0.6% |
| West | 3.5% | 2.1% | 0.4% | 1.0% |
| From Census Bureau Data | ||||
Population Growth
The New York metropolitan area continues to hold the top position, having added nearly 400,000 residents since 2010 to rise to a population of 19,950,000 residents. At its current rate of growth, New York will exceed a population of 20 million in 2014. There was a time that many expected second-place Los Angeles to overtake New York. However, since 1990 the New York population advantage over Los Angeles has expanded from 6.1 million to 6.8 million, including a further 80,000 advantage built up since 2010 (present geographical definitions). Part of this because much of the growth has been pushed to the more distant Riverside-San Bernardino area.
Los Angeles and Chicago continued to retain the second and third positions, which they seem likely to maintain for decades. Population projections by the National Conference of Mayors indicates strong growth in Dallas-Fort Worth and Houston over the next three decades could have them by pass Chicago by 2050. The challenge could be even more immediate, since Chicago's growth rate over the first three years of the decade is approximately one half the annual rate projected by the US Conference of Mayors between 2012 and 2042.
Late in the last decade, Dallas-Fort Worth passed Philadelphia to become the fourth largest metropolitan area. Then, Philadelphia was passed by Houston in 2011. The result is that, for the first time since the nation's founding, two of the five largest cities (which are functionally defined as metropolitan areas) are in a single state (Texas).
Philadelphia seems likely to fall further. The strong growth rate of seventh ranked Washington suggests that this nearby rival may also pass Philadelphia as early as 2015. Eighth ranked Miami is growing fast enough that it also could drop Philadelphia a position, to 8th place the 2020 census.
But Philadelphia is not the only metropolitan area in relative decline. Detroit started the decade as the nation's 12th largest metropolitan area, but has since fallen to 14th. Detroit has been passed by both Riverside-San Bernardino and Phoenix. Phoenix rose 14th to 12th, passing Riverside-San Bernardino (which remained in 13th position) in the process.
Among the 52 major metropolitan areas, Austin has grown at the greatest percentage rate since 2010 with Raleigh was the second fastest growing. Houston was the third fastest growing major metropolitan area over the three year period. Orlando ranked 4th in growth from 2010, while San Antonio was the fifth. The top ten was rounded out by Denver, Washington, Dallas-Fort Worth, Charlotte and Oklahoma City. Thus, among the 10 fastest-growing major metropolitan areas, nine were in the South and one (Denver) was in the West (Table 2).
| Table 2 | |||||
| Major Metropolitan Area Population: 2010, 2012 & 2013 | |||||
| Metropolitan Areas | 2010 | 2012 | 2013 | 2010-13 | 2012-13 |
| Atlanta, GA | 5,304,197 | 5,454,429 | 5,522,942 | 4.12% | 1.26% |
| Austin, TX | 1,727,784 | 1,835,110 | 1,883,051 | 8.99% | 2.61% |
| Baltimore, MD | 2,715,312 | 2,753,922 | 2,770,738 | 2.04% | 0.61% |
| Birmingham, AL | 1,129,096 | 1,134,915 | 1,140,300 | 0.99% | 0.47% |
| Boston, MA-NH | 4,564,054 | 4,642,095 | 4,684,299 | 2.63% | 0.91% |
| Buffalo, NY | 1,135,314 | 1,133,767 | 1,134,115 | -0.11% | 0.03% |
| Charlotte, NC-SC | 2,223,635 | 2,294,990 | 2,335,358 | 5.02% | 1.76% |
| Chicago, IL-IN-WI | 9,470,335 | 9,514,059 | 9,537,289 | 0.71% | 0.24% |
| Cincinnati, OH-KY-IN | 2,117,344 | 2,129,309 | 2,137,406 | 0.95% | 0.38% |
| Cleveland, OH | 2,075,690 | 2,064,739 | 2,064,725 | -0.53% | 0.00% |
| Columbus, OH | 1,906,243 | 1,944,937 | 1,967,066 | 3.19% | 1.14% |
| Dallas-Fort Worth, TX | 6,452,758 | 6,702,801 | 6,810,913 | 5.55% | 1.61% |
| Denver, CO | 2,553,829 | 2,646,694 | 2,697,476 | 5.62% | 1.92% |
| Detroit, MI | 4,291,400 | 4,292,832 | 4,294,983 | 0.08% | 0.05% |
| Grand Rapids, MI | 989,196 | 1,005,493 | 1,016,603 | 2.77% | 1.10% |
| Hartford, CT | 1,214,014 | 1,214,503 | 1,215,211 | 0.10% | 0.06% |
| Houston, TX | 5,948,689 | 6,175,466 | 6,313,158 | 6.13% | 2.23% |
| Indianapolis. IN | 1,892,323 | 1,929,207 | 1,953,961 | 3.26% | 1.28% |
| Jacksonville, FL | 1,349,095 | 1,378,040 | 1,394,624 | 3.37% | 1.20% |
| Kansas City, MO-KS | 2,013,691 | 2,038,690 | 2,054,473 | 2.03% | 0.77% |
| Las Vegas, NV | 1,953,106 | 1,997,659 | 2,027,868 | 3.83% | 1.51% |
| Los Angeles, CA | 12,844,070 | 13,037,045 | 13,131,431 | 2.24% | 0.72% |
| Louisville, KY-IN | 1,237,851 | 1,251,538 | 1,262,261 | 1.97% | 0.86% |
| Memphis, TN-MS-AR | 1,326,595 | 1,340,739 | 1,341,746 | 1.14% | 0.08% |
| Miami, FL | 5,581,524 | 5,763,282 | 5,828,191 | 4.42% | 1.13% |
| Milwaukee,WI | 1,556,549 | 1,566,182 | 1,569,659 | 0.84% | 0.22% |
| Minneapolis-St. Paul, MN-WI | 3,355,167 | 3,422,417 | 3,459,146 | 3.10% | 1.07% |
| Nashville, TN | 1,675,945 | 1,726,759 | 1,757,912 | 4.89% | 1.80% |
| New Orleans. LA | 1,195,757 | 1,227,656 | 1,240,977 | 3.78% | 1.09% |
| New York, NY-NJ-PA | 19,596,183 | 19,837,753 | 19,949,502 | 1.80% | 0.56% |
| Oklahoma City, OK | 1,257,883 | 1,297,397 | 1,319,677 | 4.91% | 1.72% |
| Orlando, FL | 2,139,372 | 2,223,456 | 2,267,846 | 6.01% | 2.00% |
| Philadelphia, PA-NJ-DE-MD | 5,971,397 | 6,019,533 | 6,034,678 | 1.06% | 0.25% |
| Phoenix, AZ | 4,208,770 | 4,327,632 | 4,398,762 | 4.51% | 1.64% |
| Pittsburgh, PA | 2,356,658 | 2,360,989 | 2,360,867 | 0.18% | -0.01% |
| Portland, OR-WA | 2,232,177 | 2,289,038 | 2,314,554 | 3.69% | 1.11% |
| Providence, RI-MA | 1,601,798 | 1,601,160 | 1,604,291 | 0.16% | 0.20% |
| Raleigh, NC | 1,137,351 | 1,188,504 | 1,214,516 | 6.78% | 2.19% |
| Richmond, VA | 1,210,015 | 1,232,954 | 1,245,764 | 2.95% | 1.04% |
| Riverside-San Bernardino, CA | 4,244,089 | 4,342,332 | 4,380,878 | 3.22% | 0.89% |
| Rochester, NY | 1,080,081 | 1,082,375 | 1,083,278 | 0.30% | 0.08% |
| Sacramento, CA | 2,154,417 | 2,193,927 | 2,215,770 | 2.85% | 1.00% |
| St. Louis,, MO-IL | 2,789,893 | 2,796,506 | 2,801,056 | 0.40% | 0.16% |
| Salt Lake City, UT | 1,091,452 | 1,123,943 | 1,140,483 | 4.49% | 1.47% |
| San Antonio, TX | 2,153,288 | 2,234,494 | 2,277,550 | 5.77% | 1.93% |
| San Diego, CA | 3,104,182 | 3,176,138 | 3,211,252 | 3.45% | 1.11% |
| San Francisco-Oakland, CA | 4,344,584 | 4,454,159 | 4,516,276 | 3.95% | 1.39% |
| San Jose, CA | 1,842,076 | 1,892,894 | 1,919,641 | 4.21% | 1.41% |
| Seattle, WA | 3,448,425 | 3,552,591 | 3,610,105 | 4.69% | 1.62% |
| Tampa-St. Petersburg, FL | 2,788,961 | 2,845,178 | 2,870,569 | 2.93% | 0.89% |
| Virginia Beach-Norfolk, VA-NC | 1,680,120 | 1,698,410 | 1,707,369 | 1.62% | 0.53% |
| Washington, DC-VA-MD-WV | 5,664,789 | 5,862,594 | 5,949,859 | 5.03% | 1.49% |
| Major Metropolitan Areas | 169,898,524 | 173,253,232 | 174,942,425 | 2.97% | 0.97% |
| From Census Bureau Data | |||||
Domestic Migration
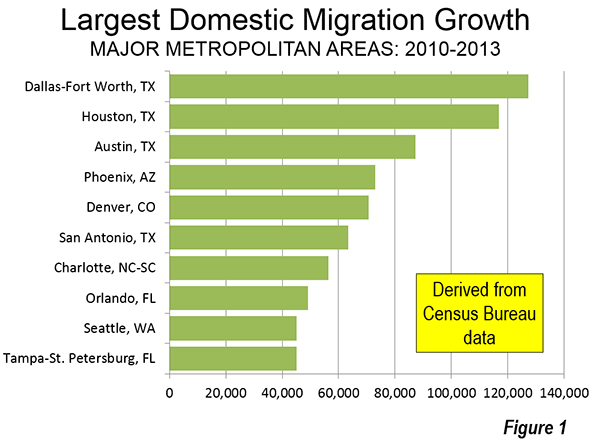
Net domestic migration is, not surprisingly, dominated by the major metropolitan areas of the South, especially Texas and Florida. Dallas-Fort Worth and Houston led the nation with more than 100,000 net domestic migrants (Figure $$$). Austin placed third in San Antonio was sixth. Charlotte ranked seventh, while the Florida entries Orlando stood at eighth and Tampa-St. Petersburg at 10th. The West had three big domestic migration lures, Phoenix (4th), Denver (5th), and Seattle (9th).
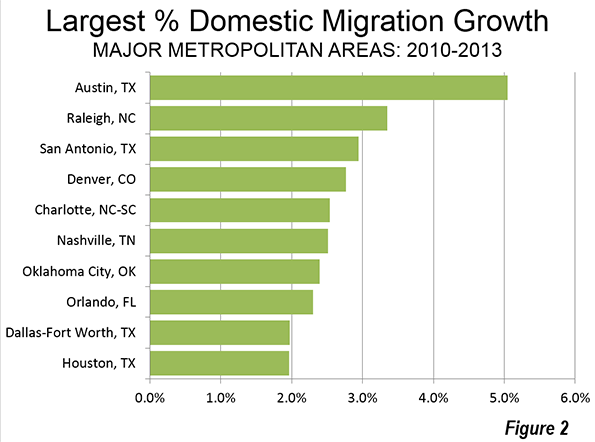
Austin also led in the percentage of net domestic migration gain relative to its 2010 population. Again, nine of the top gainers were in the South, with one entry from the West, Denver (Figure 2).
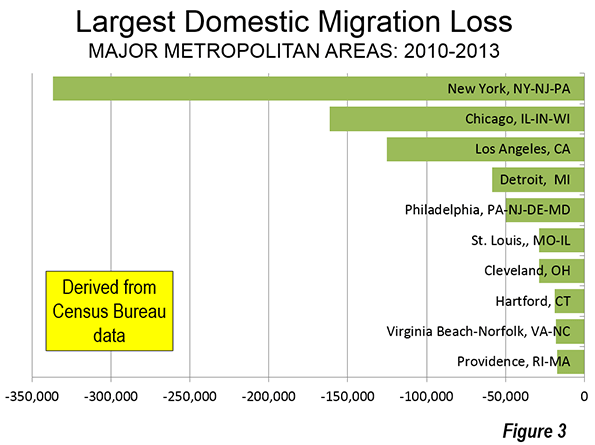
The largest net domestic migration losses were more dispersed across the country, with metropolitan areas from every region represented. New York lost the most net domestic migrants (more than 300,000) and was joined by Philadelphia, Hartford, and Providence from the East. Chicago lost the second most domestic migrants (more than 150,000) and was joined by Detroit, St. Louis and Cleveland from the Midwest. Los Angeles ranked third in the bottom 10, losing more than 100,000 net domestic migrants, the only western metropolitan area to suffer a significant migration loss. The South's only representative in the bottom 10 was Virginia Beach-Norfolk (Figure 3).
| Table 3 | ||||
| Major Metropolitan Area Net Migration: 2010 to 2013 | ||||
| Metropolitan Areas | Net Domestic Migration | Change Relative to 2010 Population | Net International Migration | Change Relative to 2010 Population |
| Atlanta, GA | 44,433 | 0.84% | 49,375 | 0.93% |
| Austin, TX | 87,189 | 5.05% | 15,685 | 0.91% |
| Baltimore, MD | (121) | 0.00% | 24,366 | 0.90% |
| Birmingham, AL | (2,918) | -0.26% | 3,585 | 0.32% |
| Boston, MA-NH | 101 | 0.00% | 70,356 | 1.54% |
| Buffalo, NY | (7,774) | -0.68% | 7,341 | 0.65% |
| Charlotte, NC-SC | 56,478 | 2.54% | 14,590 | 0.66% |
| Chicago, IL-IN-WI | (161,558) | -1.71% | 69,041 | 0.73% |
| Cincinnati, OH-KY-IN | (16,893) | -0.80% | 9,703 | 0.46% |
| Cleveland, OH | (28,780) | -1.39% | 10,837 | 0.52% |
| Columbus, OH | 11,425 | 0.60% | 13,752 | 0.72% |
| Dallas-Fort Worth, TX | 127,315 | 1.97% | 57,403 | 0.89% |
| Denver, CO | 70,668 | 2.77% | 14,160 | 0.55% |
| Detroit, MI | (58,343) | -1.36% | 30,281 | 0.71% |
| Grand Rapids, MI | 4,594 | 0.46% | 3,290 | 0.33% |
| Hartford, CT | (18,979) | -1.56% | 15,206 | 1.25% |
| Houston, TX | 116,956 | 1.97% | 74,817 | 1.26% |
| Indianapolis. IN | 13,698 | 0.72% | 12,031 | 0.64% |
| Jacksonville, FL | 16,932 | 1.26% | 9,760 | 0.72% |
| Kansas City, MO-KS | (3,738) | -0.19% | 9,162 | 0.45% |
| Las Vegas, NV | 17,419 | 0.89% | 19,041 | 0.97% |
| Los Angeles, CA | (125,037) | -0.97% | 145,101 | 1.13% |
| Louisville, KY-IN | 4,874 | 0.39% | 6,530 | 0.53% |
| Memphis, TN-MS-AR | (13,723) | -1.03% | 4,868 | 0.37% |
| Miami, FL | 31,750 | 0.57% | 152,998 | 2.74% |
| Milwaukee,WI | (14,282) | -0.92% | 6,547 | 0.42% |
| Minneapolis-St. Paul, MN-WI | 2,664 | 0.08% | 30,341 | 0.90% |
| Nashville, TN | 42,090 | 2.51% | 10,201 | 0.61% |
| New Orleans. LA | 20,721 | 1.73% | 8,727 | 0.73% |
| New York, NY-NJ-PA | (336,566) | -1.72% | 372,651 | 1.90% |
| Oklahoma City, OK | 30,086 | 2.39% | 6,759 | 0.54% |
| Orlando, FL | 49,244 | 2.30% | 43,230 | 2.02% |
| Philadelphia, PA-NJ-DE-MD | (49,564) | -0.83% | 51,244 | 0.86% |
| Phoenix, AZ | 72,985 | 1.73% | 24,885 | 0.59% |
| Pittsburgh, PA | 7,564 | 0.32% | 8,129 | 0.34% |
| Portland, OR-WA | 30,244 | 1.35% | 15,350 | 0.69% |
| Providence, RI-MA | (17,253) | -1.08% | 13,365 | 0.83% |
| Raleigh, NC | 38,088 | 3.35% | 10,875 | 0.96% |
| Richmond, VA | 10,777 | 0.89% | 9,542 | 0.79% |
| Riverside-San Bernardino, CA | 18,321 | 0.43% | 14,997 | 0.35% |
| Rochester, NY | (11,558) | -1.07% | 7,607 | 0.70% |
| Sacramento, CA | 6,922 | 0.32% | 17,662 | 0.82% |
| St. Louis,, MO-IL | (28,809) | -1.03% | 11,556 | 0.41% |
| Salt Lake City, UT | 3,367 | 0.31% | 7,560 | 0.69% |
| San Antonio, TX | 63,391 | 2.94% | 10,778 | 0.50% |
| San Diego, CA | 455 | 0.01% | 35,199 | 1.13% |
| San Francisco-Oakland, CA | 37,157 | 0.86% | 68,510 | 1.58% |
| San Jose, CA | (6,245) | -0.34% | 41,207 | 2.24% |
| Seattle, WA | 45,188 | 1.31% | 50,351 | 1.46% |
| Tampa-St. Petersburg, FL | 45,071 | 1.62% | 28,621 | 1.03% |
| Virginia Beach-Norfolk, VA-NC | (17,944) | -1.07% | 15,650 | 0.93% |
| Washington, DC-VA-MD-WV | 32,749 | 0.58% | 107,875 | 1.90% |
| Total | 240,831 | 0.14% | 1,872,698 | 1.10% |
| From Census Bureau Data | ||||
Migration Gains in the Suburbs, Losses in the Core
This year was notable for the virtual absence of the customary "return to the city" stories. In recent years, historical core municipalities have done better in population growth than in the past. In previous decades, some lost large amounts of their population. However, an improving urban environment, not least because of better crime control, has led to something of a residential resurgence, especially in the immediate area of downtowns, though inner core populations (within five miles of City Hall) have continue to decline (see Flocking Elsewhere: The Downtown Growth Story).
Specious claims of a net suburban movement to the cores have been refuted by the domestic migration data. Net domestic migration is reported by the Census Bureau only at the county level. Thus, any analysis of domestic migration between the cores and the suburbs must be county-based. During the Great Recession, domestic migration declined substantially, as is to be expected when the economy is depressed.
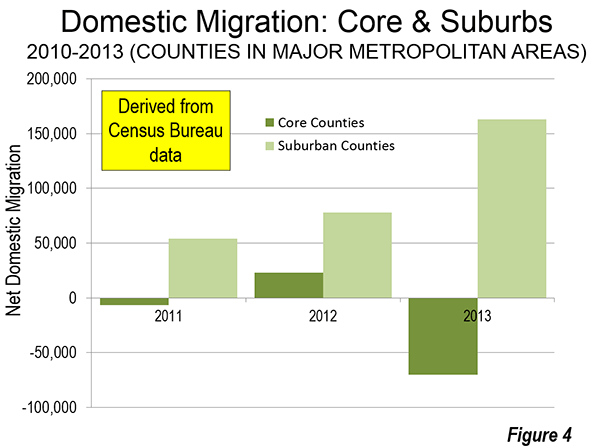
Yet, in each of the three years of this decade, suburban counties have experienced net domestic migration gains and in each year have substantially led the core counties. In only one year, 2012, was there a net domestic migration gain in the core counties. The most recent 2013 data shows that core counties experienced a 70,000 net domestic migration loss, while the suburban counties gained 163,000 net domestic migrants. This difference of 233,000 was approximately four times the demographic gains made by the suburbs in both of the previous years Figure 4).
Returning to Normalcy?
With the economy still depressed, it would be premature to declare that the more typical results of the last year presage a return to normalcy. Any such reliable judgment must await restoration of broad-based, job and salary driven – as opposed to asset-based – economic growth. However, the trends of the last year indicate more than anything that the basic patterns of at least the past quarter century – with higher suburban growth and a shift towards the South – to be reasserting themelves.
Wendell Cox is principal of Demographia, an international public policy and demographics firm. He is co-author of the "Demographia International Housing Affordability Survey" and author of "Demographia World Urban Areas" and "War on the Dream: How Anti-Sprawl Policy Threatens the Quality of Life." He was appointed to three terms on the Los Angeles County Transportation Commission, where he served with the leading city and county leadership as the only non-elected member. He was appointed to the Amtrak Reform Council to fill the unexpired term of Governor Christine Todd Whitman and has served as a visiting professor at the Conservatoire National des Arts et Metiers, a national university in Paris.
Photo: Downtown Houston (by author)


Recently many alarming
Recently many alarming reports are published about population and livability. I am in a trouble now because I am in a country which is under threat.
As this city is been
As this city is been developed so the residential area have also been increased. And now there will be more growth in those areas. But the most important thing is it need to be maintained now.