
I’ve written extensively about American presidential elections, trying to understand the nature of Democratic success in 2008 and 2012. Many pundits use these elections and changing demographics and public attitudes to write off the future of the Grand Old Party. But this would be a mistake, because we also know that Republicans have a majority in the House of Representatives and in the state legislatures. They also could well get a majority in the US Senate in 2014. Hardly a death spiral.
Certainly, gerrymandering played a role, and Democrats won a majority of the popular vote for Congress, but the majority was smaller than the margin for president, which was not as large as widely believed, and considerably less than in 2008. Given this confusion it is worth trying to make a more accurate assessment of the D and R balance. It turns out that there is a peculiar geography of the electorate at all levels and across states, that tends to help Democrats at the statewide level, due to concentrated block voting and concentrations in cities while Republicans, who hold sway over a wider geographic area, at sub-state levels. Obama won 332 electoral votes, 61%, far above his 52% share of the national vote. Democrats won 51 % of the total vote for Congress but won only 200 seats, 46 % of 435, a shortfall of up to 21 seats.
Besides the votes for president and the House of Representatives in 2012, we can look at the latest result for all 100 Senate seats, for governors of the states, and for all state legislators, in order to get a more honest assessment of Red and Blue America. What states are truly blue or red, and how many are actually more balanced than we might have thought? Finally it may be useful to compare the actual votes with opinion polls, which seem to show a country somewhat less “liberal” than electoral results. Perhaps voters are a little more liberal than they admit, but let’s see what the fuller set of data show.
President
Democrats won 332 electoral votes, 52 or 10% more than their “fair share” of 280 (52% of 538 electors). The reason for the imbalance is simply that the peculiar geography in 2012 gave the Democrats small margins in some critically large states. For Obama, CA, 55 electoral votes, FL, 29, NY, 29, IL, 20, PA 20, OH, 18, and MI, 16, versus for Romney, TX, 38, GA, 16 and NC, 15. If Romney had carried just the close OH, FL, and PA, he would have won the election! No wonder Republicans became interested in adopting the Maine and Nebraska allocation of electors by congressional district! However there is no logical basis for allocation by congressional districts, an unrelated office. Rather there is a rational and logical argument to allocate simply by the party shares of the popular vote in states. Table A shows the effect. Obama would have won but by the small margin of 275 to 263 electoral votes, reflecting the actual close division in the electorate.
| Table A | ||||
| Electoral Votes 2012 | Electoral Votes 2012 | |||
| Actual D Electoral Votes | Actual R Electoral Votes | D If Allocated by Statewide Vote Shares | R If Allocated by Statewide Vote Shares | |
| AL | 9 | 3 | 6 | |
| AK | 3 | 1 | 2 | |
| AZ | 11 | 5 | 6 | |
| AR | 6 | 2 | 4 | |
| CA | 55 | 33 | 22 | |
| CO | 9 | 5 | 4 | |
| CT | 7 | 4 | 3 | |
| DE | 3 | 2 | 1 | |
| DC | 3 | 3 | 0 | |
| FL | 29 | 15 | 14 | |
| GA | 16 | 7 | 9 | |
| HI | 4 | 3 | 1 | |
| ID | 3 | 1 | 2 | |
| IL | 20 | 12 | 8 | |
| IN | 11 | 5 | 6 | |
| IA | 6 | 3 | 3 | |
| KS | 6 | 2 | 4 | |
| KY | 8 | 3 | 5 | |
| LA | 8 | 3 | 5 | |
| ME | 4 | 2 | 2 | |
| MD | 10 | 6 | 4 | |
| MA | 11 | 7 | 4 | |
| MI | 16 | 9 | 7 | |
| MN | 10 | 5 | 5 | |
| MS | 6 | 3 | 3 | |
| MO | 10 | 4 | 6 | |
| MT | 3 | 1 | 2 | |
| NE | 5 | 2 | 3 | |
| NV | 6 | 3 | 3 | |
| NH | 4 | 2 | 2 | |
| NJ | 14 | 8 | 6 | |
| NM | 5 | 3 | 2 | |
| NY | 29 | 18 | 11 | |
| NC | 15 | 7 | 8 | |
| ND | 3 | 1 | 2 | |
| OH | 18 | 9 | 9 | |
| OK | 7 | 2 | 5 | |
| OR | 7 | 4 | 3 | |
| PA | 20 | 10 | 10 | |
| RI | 4 | 3 | 1 | |
| SC | 9 | 4 | 5 | |
| SD | 3 | 1 | 2 | |
| TN | 11 | 4 | 7 | |
| TX | 38 | 16 | 22 | |
| UT | 6 | 1 | 5 | |
| VT | 3 | 2 | 1 | |
| VA | 13 | 7 | 6 | |
| WA | 12 | 7 | 5 | |
| WV | 5 | 2 | 3 | |
| WI | 10 | 5 | 5 | |
| WY | 3 | 1 | 2 | |
| Total | 332 | 205 | 275 | 263 |
House
The situation is quite different for Congress (the House), where Republicans won 235 seats to the Democrats 200, while according to the total popular vote, the Democrats would gain a small majority based on their 50.8% share of the total vote, of 221 to 214 seats (Table B) . A lot has already been written about this, including charges of theft by gerrymandering. But if we analyze the peculiar geography again carefully, we will find that the net additional seats for the Democrats, if the seats in each state reflected the actual vote, would only be 15, not enough for a majority, simply because so many D votes are “wasted” in safe districts. In 17 states, Democrats won more seats than their share of the vote, 23, but Republicans won 38 “extra” seats in the other 33 states.
| Table B | |||||
| Actual and ideal seats in the House of Representatives | |||||
| State | Seats in state | Ideal D (according to vote share) | Actual D | Difference | Dem % |
| CA | 53 | 33 | 38 | 5 | 62% |
| NY | 27 | 18 | 21 | 3 | 65% |
| MA | 9 | 7 | 9 | 2 | 75% |
| IL | 18 | 10 | 12 | 2 | 55% |
| MD | 8 | 5 | 7 | 2 | 65% |
| CT | 5 | 3 | 5 | 2 | 66% |
| NH | 2 | 1 | 2 | 1 | 52% |
| AZ | 9 | 4 | 5 | 1 | 46% |
| RI | 2 | 1 | 2 | 1 | 59% |
| ME | 2 | 1 | 2 | 1 | 62% |
| HI | 2 | 1 | 2 | 1 | 67% |
| WA | 10 | 5 | 6 | 1 | 54% |
| OR | 5 | 3 | 4 | 1 | 58% |
| MN | 8 | 5 | 5 | 0 | 56% |
| NM | 3 | 2 | 2 | 0 | 55% |
| DE | 1 | 1 | 1 | 0 | 66% |
| VT | 1 | 1 | 1 | 0 | 76% |
| 165 | 100 | 124 | 23 | ||
| NV | 4 | 2 | 2 | 0 | 50% |
| MT | 1 | 0 | 0 | 0 | 45% |
| IA | 4 | 2 | 2 | 0 | 52% |
| WV | 3 | 1 | 1 | 0 | 40% |
| WY | 1 | 0 | 0 | 0 | 26% |
| AK | 1 | 0 | 0 | 0 | 31% |
| UT | 4 | 1 | 1 | 0 | 33% |
| CO | 7 | 3 | 3 | 0 | 49% |
| SDS | 1 | 0 | 0 | 0 | 43% |
| ND | 1 | 0 | 0 | 0 | 43% |
| LA | 6 | 1 | 1 | 0 | 24% |
| MS | 4 | 1 | 1 | 0 | 37% |
| ID | 2 | 1 | 0 | 1 | 34% |
| NJ | 12 | 7 | 6 | 1 | 56% |
| GA | 14 | 6 | 5 | 1 | 41% |
| KS | 4 | 1 | 0 | 1 | 21% |
| WI | 8 | 4 | 3 | 1 | 51% |
| NE | 3 | 1 | 0 | 1 | 36% |
| AR | 4 | 1 | 0 | 1 | 32% |
| TN | 9 | 3 | 2 | 1 | 37% |
| KY | 6 | 2 | 1 | 1 | 40% |
| MO | 8 | 3 | 2 | 1 | 43% |
| AL | 7 | 3 | 1 | 2 | 36% |
| OK | 5 | 2 | 0 | 2 | 32% |
| SC | 7 | 3 | 1 | 2 | 42% |
| IN | 9 | 4 | 2 | 2 | 46% |
| MI | 14 | 7 | 5 | 2 | 53% |
| TX | 36 | 14 | 12 | 2 | 40% |
| VA | 11 | 5 | 3 | 2 | 49% |
| NC | 13 | 7 | 4 | 3 | 51% |
| FL | 27 | 13 | 10 | 3 | 47% |
| OH | 16 | 8 | 4 | 4 | 48% |
| PA | 18 | 9 | 5 | 4 | 51% |
| US | 270 | 119 | 77 | 38 | 49% |
Note that 54 Democrats won by over 75%, compared to 34 for Republicans. Still, this does leave probably 8 or 9 districts won by Republicans because of clever gerrymanders, sometimes proudly proclaimed, as in OH and PA, 2 each, and one each in FL, MI, NC,VA and WI, more than offsetting the likely D gerrymander against Republicans in IL. But Democrats would still have lost if there had been no gerrymandering, and the net implication is that the peculiar geography of the Democrat vote means that it takes at least a 53% total Democratic plurality to win enough of the relatively few close seats to win a majority of the House.
Senate
At 2 seats per state regardless of population, Republicans have an inherent advantage to obtain a majority of senators (or governors), since they dominate a majority of states, and Democrats are over-concentrated in a few larger states. The fact that Democrats currently hold 52 of seats plus the support of independents in VT and ME, is a consequence of the timing of Senate elections and perhaps reflects the extremism of some Republican candidates, who alienated enough middle road, independent voters to swing races to the Democrats. It is also significant that in 15 states voters clearly chose to have senators from both major parties, indicating either that polarization is not so extreme as proclaimed, or that there are a number of closely divided states, that can vote R or D depending on issues, personalities, and timing. Please see the summary table C for a listing by strength of the D or R votes for senators across the states. The highest D shares (both seats) were in VT, RI, and NY, for Republicans in WY, TN, SD, and ID.
Governors
Republicans hold 29 of the 50 governors, perhaps an underlying indicator of a Republican majority. Yet, from the table you will see that Democrats elected governors in several states that lean Republican overall e.g., MO, AR, MT, and WV, and that there are Republican governors in several states won by Obama, e.g., MI, NV, NM, ME, and NJ. This ambivalence undermines any simple and strict Red versus Blue dichotomy. Many voters are not as utterly polarized as proclaimed. The most extreme Republican votes were in WY, NE, UT LA, and TN, and the highest Democratic shares in DE, NY and yes, AR, which voted only 38% for Obama.
Legislatures
Legislatures are controlled by Republicans in a majority, 26, of states, with Democrats in control in 20 states, with four state divided: Iowa, Kentucky, New Hampshire and Virginia (almost), and even Washington (de facto). The legislatures are overall the most Republican-leaning of the elections analyzed. But even here, the average share of Democrats in legislatures is a respectable 46 percent. The most extremely Republican legislatures are in WY, UT, ID, KS, TN, and SD and the most extremely Democratic are, predictably, in HI, RI, MA, VT and MD. Again in recognition that a simple red and blue dichotomy is not that certain is the fact that in four states, KY, IA, VA, and NH, the legislative houses are split between the parties.
So what is the best estimate of the real division between Red and Blue America?
Table C ranks the states by my composite average index based on the races for president, the House of Representatives, state legislatures, US senators and governors. The numbers (percents) are the Democratic share of the vote for president, for the US house, for US senators and for governors, but for state legislatures, the percent shares of legislators who are Democrats. The final column Is a simple average of these five values. In this way I can distinguish those states which are consistently Democrat or Republican, from those which really are less polarized and more balanced.
| TABLE C: Summary of Democratic-Republican Voting Record | |||||||||||
| Electoral Votes | President %D | Congress %D | State Legislatures | Senators %D | Governors %D | Number of D Wins | Composite Index | ||||
| Sen %D | House %D | Legis Ave. | Type | ||||||||
| WY | 3 | 28.8 | 25.7 | 13.3 | 13.3 | 13.3 | 25 | 27 | 0 | 24.0 | R++ |
| UT | 6 | 25.4 | 33.4 | 17.2 | 18.7 | 18.0 | 34.75 | 34 | 0 | 29.1 | R++ |
| KS | 6 | 38.9 | 20.9 | 22.5 | 26.4 | 24.5 | 33.25 | 36 | 0 | 30.7 | R++ |
| ID | 4 | 33.6 | 33.9 | 17.1 | 18.6 | 17.9 | 33.5 | 39 | 0 | 31.6 | R++ |
| OK | 7 | 33.2 | 32.4 | 25.0 | 28.7 | 26.9 | 35 | 40 | 0 | 33.5 | R++ |
| TN | 11 | 39.6 | 36.8 | 21.2 | 27.6 | 24.4 | 34 | 35 | 0 | 34.0 | R++ |
| SD | 3 | 40.8 | 42.6 | 20.0 | 24.3 | 22.1 | 31.25 | 38.5 | 0 | 35.0 | R++ |
| NE | 5 | 38.9 | 35.8 | 42 | 27 | 0 | 35.9 | R+ | |||
| ND | 3 | 39.9 | 43.2 | 28.3 | 24.5 | 26.4 | 36.75 | 35.5 | 0 | 36.3 | R+ |
| AL | 9 | 38.8 | 36.0 | 25.5 | 37.1 | 31.3 | 35.6 | 42 | 0 | 36.7 | R+ |
| LA | 8 | 41.3 | 23.9 | 41.0 | 42.9 | 41.9 | 47.5 | 34 | 0 | 37.7 | R+ |
| AK | 3 | 42.7 | 30.9 | 35.0 | 37.5 | 36.3 | 38.25 | 41 | 0 | 37.8 | R+ |
| MS | 6 | 44.2 | 36.9 | 36.5 | 47.9 | 42.2 | 40.3 | 38 | 0 | 40.3 | R |
| GA | 16 | 46.0 | 40.8 | 32.1 | 33.3 | 32.7 | 41.75 | 46 | 0 | 41.5 | R |
| TX | 38 | 42.0 | 40.0 | 38.7 | 36.7 | 37.7 | 43.25 | 45 | 0 | 41.6 | R |
| SC | 9 | 44.7 | 42.0 | 39.1 | 37.7 | 38.4 | 38.25 | 48 | 0 | 42.3 | R |
| IN | 11 | 44.8 | 45.8 | 26.0 | 31.0 | 28.5 | 47.25 | 48.2 | 0 | 42.9 | R |
| AZ | 11 | 45.4 | 45.6 | 43.3 | 40.0 | 41.7 | 43.25 | 45 | 0 | 44.2 | R |
| FL | 29 | 50.4 | 47.0 | 35.0 | 38.3 | 36.7 | 40.5 | 49.3 | 1 | 44.8 | R |
| MO | 10 | 45.2 | 43.3 | 29.4 | 32.5 | 31.0 | 49.5 | 55.5 | 1 | 44.9 | R |
| KY | 8 | 38.5 | 40.0 | 40.0 | 55.0 | 47.5 | 45.7 | 56 | 1 | 45.5 | R |
| NC | 15 | 49.0 | 50.9 | 36.0 | 35.8 | 35.9 | 48.5 | 44.5 | 1 | 45.8 | R |
| OH | 18 | 51.5 | 47.9 | 30.3 | 39.4 | 34.8 | 47 | 49.5 | 1 | 46.2 | R |
| 239 | |||||||||||
| AR | 6 | 37.8 | 32.3 | 40.0 | 49.0 | 44.5 | 59.75 | 64.5 | 2 | 47.8 | BalR |
| MT | 3 | 43.0 | 44.5 | 46.0 | 37.0 | 41.5 | 62 | 50.5 | 2 | 48.3 | BalR |
| WI | 10 | 53.5 | 50.8 | 45.5 | 39.4 | 42.4 | 50.5 | 47 | 3 | 48.8 | BalR |
| PA | 20 | 52.7 | 50.8 | 46.0 | 45.8 | 45.9 | 51.5 | 45.5 | 3 | 49.3 | BalR |
| IA | 6 | 53.0 | 51.5 | 52.0 | 47.0 | 49.5 | 48.6 | 45 | 2 | 49.5 | BalR |
| WV | 5 | 36.3 | 40.1 | 70.6 | 54.0 | 62.3 | 57.5 | 52 | 3 | 49.6 | BalR |
| 50 | |||||||||||
| MI | 16 | 54.8 | 52.7 | 31.6 | 46.4 | 39.0 | 61.5 | 42 | 3 | 50.0 | BalD |
| VA | 13 | 52.0 | 49.0 | 50.0 | 32.0 | 41.0 | 59 | 50.8 | 3 | 50.4 | BalD |
| NH | 4 | 52.8 | 52.2 | 45.8 | 55.3 | 50.5 | 45.25 | 54 | 4 | 51.0 | BalD |
| NV | 6 | 53.4 | 49.8 | 52.4 | 64.3 | 58.3 | 50.5 | 46 | 3 | 51.6 | BalD |
| 39 | |||||||||||
| CO | 9 | 52.7 | 48.6 | 54.3 | 56.9 | 55.6 | 52.25 | 56 | 4 | 53.0 | D |
| NM | 5 | 55.3 | 55.2 | 59.5 | 55.7 | 57.6 | 56.5 | 46.4 | 4 | 54.2 | D |
| ME | 4 | 57.9 | 61.7 | 60.0 | 56.7 | 58.3 | 46.5 | 49 | 3 | 54.7 | D |
| WA | 12 | 57.6 | 54.4 | 51.0 | 56.1 | 53.6 | 56.5 | 51.5 | 5 | 54.7 | D |
| OR | 8 | 56.3 | 58.0 | 53.3 | 57.6 | 55.5 | 54.75 | 50.4 | 5 | 55.0 | D |
| MN | 10 | 53.9 | 56.3 | 58.2 | 54.5 | 56.3 | 58.25 | 50.5 | 5 | 55.1 | D |
| NJ | 14 | 59.0 | 55.6 | 60.0 | 60.0 | 60.0 | 58 | 46 | 4 | 55.7 | D |
| IL | 20 | 58.6 | 55.4 | 67.8 | 60.2 | 64.0 | 59.5 | 50.5 | 5 | 57.6 | D |
| CT | 7 | 58.8 | 65.5 | 61.1 | 64.9 | 63.0 | 55.25 | 50.3 | 5 | 58.6 | D |
| CA | 55 | 61.9 | 62.0 | 68.4 | 70.0 | 69.2 | 58.25 | 53 | 5 | 60.9 | D+ |
| MD | 10 | 63.3 | 65.5 | 74.5 | 69.5 | 72.0 | 61.25 | 56 | 5 | 63.6 | D+ |
| NY | 29 | 64.3 | 64.8 | 52.4 | 70.5 | 61.4 | 67.25 | 62 | 5 | 64.0 | D+ |
| DE | 3 | 59.4 | 65.8 | 61.9 | 65.9 | 63.9 | 62.75 | 70 | 5 | 64.4 | D+ |
| RI | 4 | 64.0 | 59.0 | 84.2 | 92.0 | 88.1 | 69 | 53 | 5 | 66.6 | D++ |
| MA | 11 | 61.8 | 74.9 | 90.0 | 81.9 | 85.9 | 60 | 52 | 5 | 66.9 | D++ |
| VT | 3 | 68.2 | 75.6 | 76.7 | 67.6 | 72.1 | 69 | 51 | 5 | 67.2 | D++ |
| HI | 4 | 71.7 | 67.5 | 96.0 | 86.3 | 91.1 | 69.3 | 58 | 5 | 71.5 | D++ |
| DC | 3 | 95.0 | |||||||||
| 211 | |||||||||||
Overall 23 states with 239 electoral votes lean fairly strongly Republican across the 5 measures, despite Obama carrying FL and OH, and six more states were somewhat balanced, but leaning moderately Republican, with 50 electoral votes. Of these Obama won 3, WI, PA, and VA, but none of the 5 Obama-carried states in these sets can be considered safely Democratic. Seven states had composite indices less than 35% D, a fairly extreme set. Five states were quite Republican with indices 35 to 40 Democratic, and a larger number, 11, were less strongly or consistently Republican (indices 40 to 46}. The six marginally Republican states, with indices 47.8 to 49.6, all have a mixed pattern of Democratic and of Republican majority percents. AR, MT and WV are an interesting subset, with a less “urban liberal” kind of Democratic tradition.
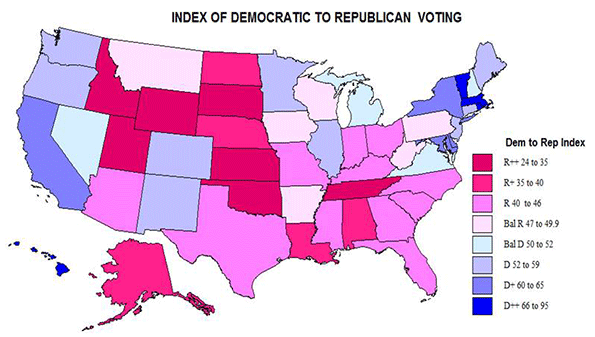
Seventeen states (plus the District of Columbia) have Democratic indices over 53. With four (RI, VT, HI, MA) and DC in the over 65 set, 4 in the moderately strong D set, 60 to 65, CA, MD, NY, and DE, and then 9 is the group with D indices from 53 to 60. But note that 4 of these had a Republican majority in some category. The remaining 4 states with indices from 50 to 52, are only marginally D, and indeed are quite mixed across the categories, almost a classic definition of balance. What all the 21 D leaning states have in common is that Obama won them in 2012.
In summary Republicans are stronger overall in 29 states with 289 electoral votes, to Democrats in 21 states (+DC) with 249 electoral votes. Democrats can overcome this territorial Republicanism only by the peculiar geography of their huge urban vote, which can enable them to carry marginally Republican states.
Thus, as to the presidential election in 2016, is there hope for the Republicans? I am convinced that there is now a national consensus that the time has come for a woman president, and that Hilary Clinton can match or even beat Obama’s lopsided 2008 victory, because potentially millions of women will defy their husbands and desert their otherwise moderate conservatism and vote for Clinton. Otherwise the Democrats would be in a desperate situation.
But 2014 is an entirely different proposition. If we ignore the first column (presidential), Republicans are in a very strong position for the Senate, the House, governors, and legislatures. This outcome is likely, despite the demographic transition from domination by older white males to younger, more liberal, more urban generations. But moderately conservative folk remain the majority, as attested to by the latest national polls. For example, Gallup polls show conservatives at 38%, liberals at 23 (the highest ever but still unimpressive) and moderates at 34%. The Republican failure to take advantage of this inherent moderate majority reflects the problem with reactionary conservatism that enables Democrats, and liberals (not coincident) to thrive beyond their numbers.
Richard Morrill is Professor Emeritus of Geography and Environmental Studies, University of Washington. His research interests include: political geography (voting behavior, redistricting, local governance), population/demography/settlement/migration, urban geography and planning, urban transportation (i.e., old fashioned generalist).


