
According to the Wall Street Journal, there are "Signs of a Suburban Comeback." This is a turnaround from the typical media coverage of US population estimates in recent years, which have more often than not heralded a "return to the cities" generally more rooted in anecdote than data.
There were always at least two problems with the "return to the city" thesis. First of all, most people who live in the suburbs came from areas outside metropolitan areas and they couldn't return to where they had never lived (see Cities and Suburbs: The Unexpected Truth). More importantly, in every year for which there is data, the net inward migration to suburbs has been far greater than to the core counties, which have nearly always had net outward migration (see Special Report: 2013 Metropolitan Area Population Estimates. Under these conditions, there could not have been net migration from the suburbs to the core municipalities.
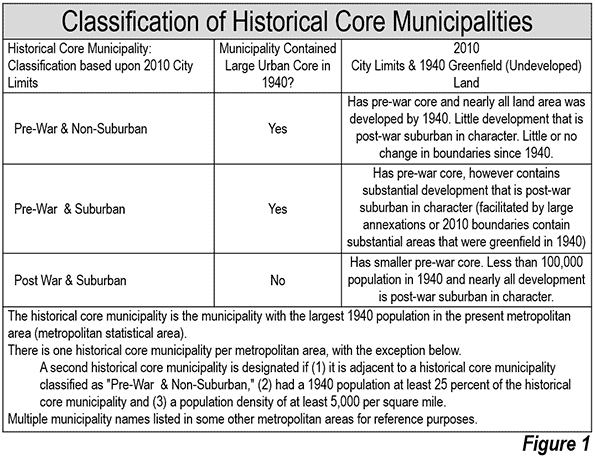
Historical Core Municipalities: The Differences
I have classified historical core municipalities based on their extent of automobile oriented suburbanization (Figure 1). The break point is World War II, after which the great automobile suburbanization occurred in the United States. There had been automobile oriented suburbanization before 1940. During the 1920s, annual rates of suburban growth exceeded five percent in the 14 metropolitan areas with more than 500,000 population. The decade of the Great Depression (1930 to 1940) saw annual growth rates drop three quarters (Note). By the end of World War II, transit had seen its motorized urban travel market share restored to 35 percent, equal to early 1920s levels, a figure that has since fallen to under two percent.
Historical Core Municipalities: Improving Trends
Even so, in recent years, the core municipalities have done better than in the past. The nightmare that occurred between 1970 and 1990 seems to be over in many places. This has made it feasible for an increase in core living by many Millennials and singles. However, even this has been exaggerated by anecdotal research that dominates the media. More than 80 percent of Millennials live outside the core municipalities, where they are less visible to the anecdote-driven media.
On a percentage basis, the historical core municipalities of the 52 major metropolitan areas (more than 1,000,000 population) managed to grow 3.4 percent between 2010 and 2013, more than the suburban rate of 3.1 percent. This is probably the first time this has occurred in any three year period since the end of World War II.
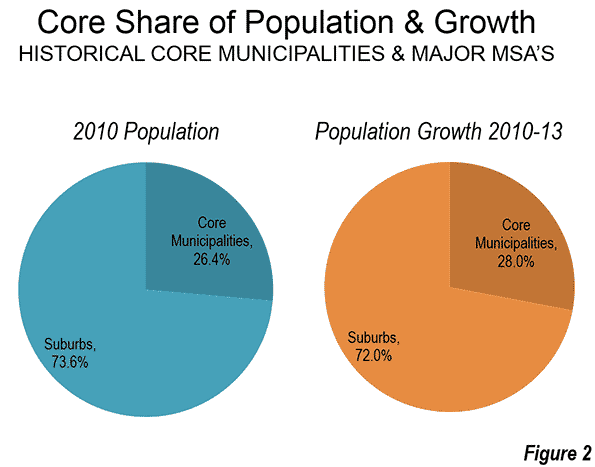
But the core municipalities now contain such a small share of major metropolitan area population that the suburbs have continued to add population at about three times the numbers of the core municipalities (Figure 2). Indeed, if the respective 2010-2013 annual growth rates were to prevail for the next century, the core municipalities would house only 28.0 percent of the major metropolitan area population in 2113 (up from 26.4 percent in 2013).
Despite the publicity to the contrary, only six core municipalities added more population than suburbs in the same metropolitan areas between 2010 and 2013. These were New York, San Antonio, Columbus, San Jose, Austin, and New Orleans, all except New York with substantial suburbanization within their city limits. The core municipalities did better in percentage gains, with 19 gaining faster than the suburbs, compared to 33 suburban areas growing faster than the core municipalities.
Core Municipality Growth
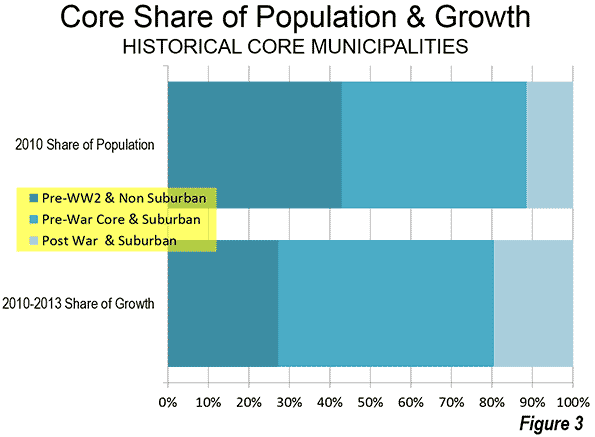
Most of the 2010 to 2013 core growth occurred in municipalities with a larger suburban component. The core municipalities that have little suburban development ("Pre-War & Non-Suburban") had 43 percent of the core population in 2010. Yet they attracted only 27 percent of the growth (Figure 3). The two other categories, which include large areas of functional suburbanization (low density and strong automobile orientation) attracted 73 percent of the core population (Figure 3). These include suburbanized pre-War core municipalities, such as Los Angeles, Seattle, and Atlanta. They also include cores that are nearly all suburban, with nearly all of their population growth having occurred during the great automobile suburbanization (such as Austin, Sacramento, Phoenix, and San Jose).
Core Municipalities: Top Gainers
New York led the core municipalities by adding 230,000 new residents between 2010 and 2013. This was 56 percent of the population growth among the "Pre-War & Non-Suburban” core municipalities. The core municipality accounted for 60 percent of the population growth in the metropolitan area. However, domestic migrants continued to move away from New York City. Core municipality losses were 215,000 from 2010 to 2013, while the suburbs, with more than 55 percent of the population, lost less than a third as many (70,000).
Houston gained 96,000 new residents between 2010 and 2013, followed by Austin (95,000), Los Angeles (92,000), and San Antonio (82,000). Houston, Los Angeles, and San Antonio each have large suburban areas within their city limits, while the core municipality of Austin is virtually all automobile-oriented. The sixth through 10th positions were taken by Phoenix, Dallas, San Jose, Denver, and San Diego, all with substantial suburbanization.
The largest core municipality population gains were in Austin (12.0 percent), still recovering New Orleans (10.1 percent), Denver (8.3 percent), Washington (7.4 percent), and Orlando (6.1 percent). Seattle, Raleigh, Atlanta, San Antonio and San Jose rounded out the top ten. Among the 10 fastest growing core municipalities, all but Washington have large automobile-oriented suburban components.
There was also bad news. Detroit continued its population slide, now down to 689,000 from its 1950 peak of 1,850,000. This 62.76 percent loss, however, is not the worst among major US core municipalities. St. Louis still holds that title, having fallen from 857,000 in 1950 to 318,000 in 2013, a loss of 62.84 percent. However, one more year of losses at the 2010-2013 rates will transfer this dubious title to Detroit.
Suburban Areas: Top Gainers
The largest suburban gains were in Dallas-Fort Worth (325,000), Houston (296,000), Washington (269,000), Miami (245,000) and Los Angeles (211,000). Atlanta, which had virtually set the world standard for suburbanization before the Great Financial Crisis, managed to re-emerge with the sixth fastest largest suburban increase (208,000).
Measured on a percentage basis, Texas dominated the suburban gains. The suburbs of Houston added 7.8 percent to their population between 2010 and 2013. Austin added 7.7 percent, San Antonio added 6.6 percent, and Dallas-Fort Worth 6.2 percent. The only non-Texas entry in the top five was Raleigh, which, like Austin, posted a 7.7 percent increase.
The metropolitan area and historical core municipality data is summarized in the Table.
| Table: Metropolitan Area & Historical Core Municipality Population: 2010-2013 | |||||||
| Metropolitan Area | Historical Core Municipality | ||||||
| Rank | Metropolitan Area | 2010 | 2013 | % Change | 2010 | 2013 | % Change |
| 1 | New York, NY-NJ-PA | 19.566 | 19.950 | 2.0% | 8.175 | 8.406 | 2.8% |
| 2 | Los Angeles, CA | 12.829 | 13.131 | 2.4% | 3.793 | 3.884 | 2.4% |
| 3 | Chicago, IL-IN-WI | 9.461 | 9.537 | 0.8% | 2.696 | 2.719 | 0.9% |
| 4 | Dallas-Fort Worth, TX | 6.426 | 6.811 | 6.0% | 1.198 | 1.258 | 5.0% |
| 5 | Houston, TX | 5.920 | 6.313 | 6.6% | 2.099 | 2.196 | 4.6% |
| 6 | Philadelphia, PA-NJ-DE-MD | 5.965 | 6.035 | 1.2% | 1.526 | 1.553 | 1.8% |
| 7 | Washington, DC-VA-MD-WV | 5.636 | 5.950 | 5.6% | 0.602 | 0.646 | 7.4% |
| 8 | Miami, FL | 5.565 | 5.828 | 4.7% | 0.399 | 0.418 | 4.6% |
| 9 | Atlanta, GA | 5.287 | 5.523 | 4.5% | 0.420 | 0.448 | 6.6% |
| 10 | Boston, MA-NH | 4.552 | 4.684 | 2.9% | 0.618 | 0.646 | 4.6% |
| 11 | San Francisco-Oakland, CA | 4.335 | 4.516 | 4.2% | 1.196 | 1.244 | 4.0% |
| 12 | Phoenix, AZ | 4.193 | 4.399 | 4.9% | 1.446 | 1.513 | 4.7% |
| 13 | Riverside-San Bernardino, CA | 4.225 | 4.381 | 3.7% | 0.210 | 0.214 | 1.8% |
| 14 | Detroit, MI | 4.296 | 4.295 | 0.0% | 0.714 | 0.689 | -3.5% |
| 15 | Seattle, WA | 3.440 | 3.610 | 5.0% | 0.609 | 0.652 | 7.2% |
| 16 | Minneapolis-St. Paul, MN-WI | 3.349 | 3.459 | 3.3% | 0.668 | 0.695 | 4.1% |
| 17 | San Diego, CA | 3.095 | 3.211 | 3.7% | 1.307 | 1.356 | 3.7% |
| 18 | Tampa-St. Petersburg, FL | 2.783 | 2.871 | 3.1% | 0.336 | 0.353 | 5.1% |
| 19 | St. Louis,, MO-IL | 2.788 | 2.801 | 0.5% | 0.319 | 0.318 | -0.3% |
| 20 | Baltimore, MD | 2.711 | 2.771 | 2.2% | 0.621 | 0.622 | 0.2% |
| 21 | Denver, CO | 2.543 | 2.697 | 6.1% | 0.600 | 0.649 | 8.2% |
| 22 | Pittsburgh, PA | 2.356 | 2.361 | 0.2% | 0.306 | 0.306 | 0.0% |
| 23 | Charlotte, NC-SC | 2.217 | 2.335 | 5.3% | 0.787 | 0.823 | 4.5% |
| 24 | Portland, OR-WA | 2.226 | 2.315 | 4.0% | 0.584 | 0.609 | 4.4% |
| 25 | San Antonio, TX | 2.143 | 2.278 | 6.3% | 1.327 | 1.409 | 6.1% |
| 26 | Orlando, FL | 2.134 | 2.268 | 6.3% | 0.238 | 0.255 | 7.2% |
| 27 | Sacramento, CA | 2.149 | 2.216 | 3.1% | 0.466 | 0.480 | 2.8% |
| 28 | Cincinnati, OH-KY-IN | 2.115 | 2.137 | 1.1% | 0.297 | 0.298 | 0.2% |
| 29 | Cleveland, OH | 2.077 | 2.065 | -0.6% | 0.397 | 0.390 | -1.7% |
| 30 | Kansas City, MO-KS | 2.009 | 2.054 | 2.2% | 0.460 | 0.467 | 1.6% |
| 31 | Las Vegas, NV | 1.951 | 2.028 | 3.9% | 0.584 | 0.603 | 3.4% |
| 32 | Columbus, OH | 1.902 | 1.967 | 3.4% | 0.787 | 0.823 | 4.5% |
| 33 | Indianapolis. IN | 1.888 | 1.954 | 3.5% | 0.820 | 0.843 | 2.8% |
| 34 | San Jose, CA | 1.837 | 1.920 | 4.5% | 0.946 | 0.999 | 5.6% |
| 35 | Austin, TX | 1.716 | 1.883 | 9.7% | 0.790 | 0.885 | 12.0% |
| 36 | Nashville, TN | 1.671 | 1.758 | 5.2% | 0.601 | 0.634 | 5.5% |
| 37 | Virginia Beach-Norfolk, VA-NC | 1.677 | 1.707 | 1.8% | 0.243 | 0.246 | 1.4% |
| 38 | Providence, RI-MA | 1.601 | 1.604 | 0.2% | 0.178 | 0.178 | 0.0% |
| 39 | Milwaukee,WI | 1.556 | 1.570 | 0.9% | 0.595 | 0.599 | 0.7% |
| 40 | Jacksonville, FL | 1.346 | 1.395 | 3.6% | 0.822 | 0.843 | 2.5% |
| 41 | Memphis, TN-MS-AR | 1.325 | 1.342 | 1.3% | 0.647 | 0.653 | 1.0% |
| 42 | Oklahoma City, OK | 1.253 | 1.320 | 5.3% | 0.580 | 0.611 | 5.3% |
| 43 | Louisville, KY-IN | 1.236 | 1.262 | 2.1% | 0.597 | 0.610 | 2.1% |
| 44 | Richmond, VA | 1.208 | 1.246 | 3.1% | 0.204 | 0.214 | 4.8% |
| 45 | New Orleans. LA | 1.190 | 1.241 | 4.3% | 0.344 | 0.379 | 10.1% |
| 46 | Hartford, CT | 1.212 | 1.215 | 0.2% | 0.125 | 0.125 | 0.2% |
| 47 | Raleigh, NC | 1.130 | 1.215 | 7.4% | 0.404 | 0.432 | 6.9% |
| 48 | Salt Lake City, UT | 1.088 | 1.140 | 4.8% | 0.186 | 0.191 | 2.5% |
| 49 | Birmingham, AL | 1.128 | 1.140 | 1.1% | 0.212 | 0.212 | -0.1% |
| 50 | Buffalo, NY | 1.136 | 1.134 | -0.1% | 0.261 | 0.259 | -0.9% |
| 51 | Rochester, NY | 1.080 | 1.083 | 0.3% | 0.211 | 0.210 | -0.1% |
| 52 | Grand Rapids, MI | 0.989 | 1.017 | 2.8% | 0.188 | 0.192 | 2.3% |
| Total | 169.512 | 174.942 | 3.2% | 44.739 | 46.258 | 3.4% | |
| In Millions: Data from US Census Bureau | |||||||
Normalcy Knocks?
Ken Johnson, the frequently quoted University of New Hampshire demographer told the Wall Street Journal, "The slowing growth in these urban cores and the increasing gains in the suburbs may be the first indication of a return to more traditional patterns of city-suburban growth." These patterns are of long standing. Nearly all urban population growth since World War II has been suburban, whether within or outside the core municipalities. It should not be surprising that suburban growth dropped during the second greatest economic decline in a century and has been slow to recover during the Great Recession and the Great Malaise that has followed. The one-quarter suburban growth rate drop was more modest than during the Great Depression, but still substantial. Should genuine prosperity return, it will likely be accompanied by a renewal of more robust suburban growth.
Note: Core municipality growth also dropped in the 1930s, as the high rate of migration from rural to urban areas in the 1920s was interrupted due to the economic reversal.
Wendell Cox is principal of Demographia, an international public policy and demographics firm. He is co-author of the "Demographia International Housing Affordability Survey" and author of "Demographia World Urban Areas" and "War on the Dream: How Anti-Sprawl Policy Threatens the Quality of Life." He was appointed to three terms on the Los Angeles County Transportation Commission, where he served with the leading city and county leadership as the only non-elected member. He was appointed to the Amtrak Reform Council to fill the unexpired term of Governor Christine Todd Whitman and has served as a visiting professor at the Conservatoire National des Arts et Metiers, a national university in Paris.


