
The nation’s lackluster economic performance continues to be a concern. This is evident in stubbornly high unemployment rates (See: Suburban and Urban Core Poverty: 2012 Special Report),which continue to be well above historic norms. There is another indicator, which may be even more important – underemployment. This figure, 80 percent above the unemployment rate, can be used as a measure of the “output gap,” which a Congressional Research Service (CRS) report refers to as “the rate of actual output (economic) growth compared with the rate of potential output growth.” CRS continues: “Potential output is a measure of the economy’s capacity to produce goods and services when resources (e.g., labor) are fully utilized” (Note 1).
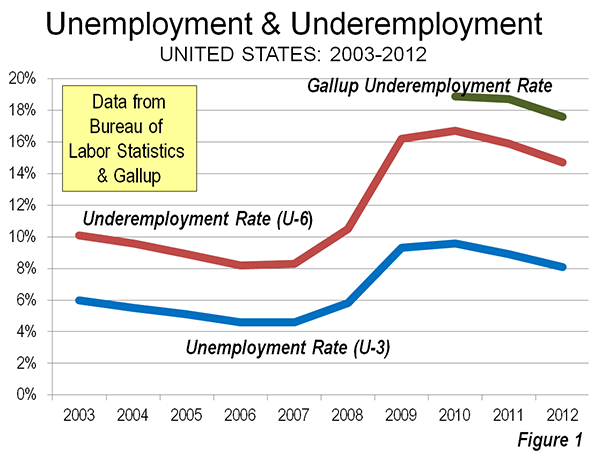
Both rates are reported by the Department of Labor, Bureau of Labor Statistics (BLS). The national underemployment rate (BLS “U-6” labor underutilization measure) is far higher than the unemployment rate (BLS “U-3” labor underutilization measure). The 2012 underemployment rate was 14.7 percent, compared to the unemployment rate of 8.1 percent. The total unemployed population was 12.5 million in 2012, while the total underemployed population was 23.1 million.
The difference between underemployment and unemployment comes by adding two groups: marginally attached workers and workers on part-time schedules for economic reasons. According to BLS, marginally attached workers are not counted as unemployed because they have not looked for work within the last four weeks, but they have sought work within the last year and are available for employment. Marginally attached workers include “discouraged” workers, who are not looking for work “because they believe there are no jobs available or there are none for which they would qualify.” In 2012, there were approximately 2.5 million marginally attached workers, including 900,000 “discouraged” workers.
However, there was a much larger number of involuntary part time workers, at 8.1 million in 2012. This is nearly two-thirds of the 12.5 million workers unemployed in 2012.
The number of underemployed may be higher. Gallup estimated the nation’s underemployment rate at 17.4 percent in August, well above the BLS August figure of 14.7 percent. The Gallup estimate would place underemployed workers at more than 27 million. This is approximately equal to all of the combined employment in the first and second largest states, California and Texas, as well as Colorado (Figure 1).
Indeed, the number of underemployed could be higher yet. Economists Richard Vedder, Christopher Denhart, and Jonathan Robe at the Center for College Affordability and Productivity have estimated that 48 percent of employed college graduates hold jobs that do not require college degrees, using BLS data. None of these, as long as they are full time employees, would be included in the underemployment figures.
Underemployment by State
In addition to its monthly national estimates, BLS provides quarterly, year-on-year estimates by state, but only for Los Angeles County and New York City below the state level. Data is shown for 2006, the year of the best underemployment rate in the last decade, 2010, with the worst underemployment rate and the most recent year for which data is available, ending June 30, 2013 (Table).
| Underemployment Rates | ||||
| by State, Los Angeles County & New York City | ||||
| 2006 | 2010 | 2013q2* | Rank | |
| United States | 8.2% | 16.7% | 14.3% | |
| Alabama | 7.3% | 17.3% | 13.0% | 22 |
| Alaska | 11.8% | 14.3% | 12.4% | 16 |
| Arizona | 7.6% | 18.4% | 15.7% | 42 |
| Arkansas | 9.1% | 14.5% | 13.6% | 25 |
| California | 9.1% | 22.1% | 18.3% | 50 |
| Colorado | 7.9% | 15.4% | 13.8% | 28 |
| Connecticut | 7.8% | 15.7% | 14.6% | 37 |
| Delaware | 6.4% | 14.3% | 14.1% | 30 |
| District of Columbia | 9.8% | 14.0% | 14.1% | 30 |
| Florida | 6.2% | 19.3% | 15.1% | 39 |
| Georgia | 8.1% | 17.9% | 15.6% | 40 |
| Hawaii | 6.2% | 16.9% | 11.4% | 12 |
| Idaho | 6.9% | 16.3% | 13.6% | 25 |
| Illinois | 8.1% | 17.5% | 16.1% | 47 |
| Indiana | 8.1% | 17.4% | 14.5% | 36 |
| Iowa | 6.7% | 11.6% | 9.5% | 5 |
| Kansas | 7.4% | 12.4% | 10.9% | 9 |
| Kentucky | 9.3% | 16.4% | 14.3% | 34 |
| Louisiana | 8.1% | 12.9% | 12.5% | 18 |
| Maine | 8.2% | 15.2% | 14.2% | 32 |
| Maryland | 6.5% | 13.0% | 12.0% | 15 |
| Massachusetts | 8.2% | 14.3% | 13.3% | 23 |
| Michigan | 12.2% | 21.0% | 16.1% | 47 |
| Minnesota | 7.9% | 13.8% | 11.2% | 11 |
| Mississippi | 10.2% | 17.6% | 15.8% | 45 |
| Missouri | 8.0% | 15.8% | 12.4% | 16 |
| Montana | 6.9% | 14.9% | 12.7% | 20 |
| Nebraska | 6.1% | 8.6% | 8.7% | 3 |
| Nevada | 6.8% | 23.6% | 19.0% | 51 |
| New Hampshire | 6.1% | 11.8% | 11.1% | 10 |
| New Jersey | 7.8% | 15.7% | 15.7% | 42 |
| New Mexico | 7.5% | 15.6% | 13.7% | 27 |
| New York | 7.7% | 14.8% | 14.2% | 32 |
| North Carolina | 8.6% | 17.4% | 15.6% | 40 |
| North Dakota | 6.2% | 7.4% | 6.2% | 1 |
| Ohio | 9.7% | 16.9% | 13.5% | 24 |
| Oklahoma | 7.3% | 11.4% | 10.0% | 6 |
| Oregon | 10.4% | 20.0% | 16.9% | 49 |
| Pennsylvania | 8.0% | 14.7% | 13.8% | 28 |
| Rhode Island | 8.9% | 19.2% | 15.9% | 46 |
| South Carolina | 10.8% | 18.1% | 15.0% | 38 |
| South Dakota | 6.2% | 9.7% | 7.8% | 2 |
| Tennessee | 8.7% | 16.6% | 14.3% | 34 |
| Texas | 8.6% | 14.4% | 11.6% | 13 |
| Utah | 5.8% | 15.1% | 10.5% | 7 |
| Vermont | 6.4% | 12.5% | 10.5% | 7 |
| Virginia | 6.0% | 12.9% | 11.6% | 13 |
| Washington | 9.4% | 18.4% | 15.7% | 42 |
| West Virginia | 8.8% | 14.0% | 12.5% | 18 |
| Wisconsin | 8.1% | 14.8% | 12.9% | 21 |
| Wyoming | 5.8% | 11.5% | 9.0% | 4 |
| Los Angeles County | 9.1% | 24.3% | 20.5% | |
| New York City | 8.7% | 15.6% | 15.1% | |
| Source: Bureau of Labor Statistics | ||||
| *2013q3: Year ended June 30, 2013 | ||||
Worst Performing States
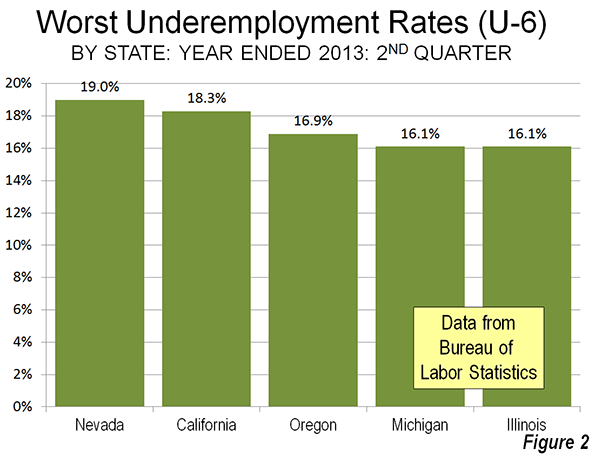
Underemployment in the states is highest in some Western and Midwestern states. For the 12 months ended June 30, Nevada had the highest underemployment rate, at 20.3 percent. California was second, at 19.3 percent, while Oregon had the third highest underemployment rate, at 16.9 percent. Michigan and Illinois were tied for fourth highest, at 16.1 percent (Figure 2).
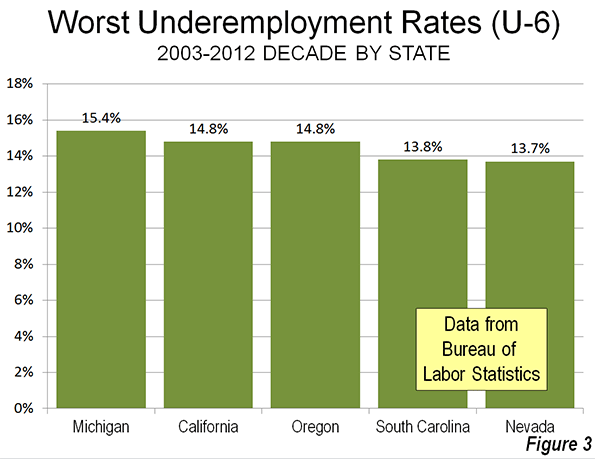
Over the past decade (2003 through 2012), four of these states were among the five with the highest underemployment rates. Michigan, hard hit by manufacturing losses, had the highest average underemployment rate (15.6 percent), followed by California and Oregon (both at 14.8 percent), South Carolina (13.8 percent) and Nevada (13.7 percent). For the most part, underemployment has become intractable in these states. Only Nevada, with its precipitous decline from the housing crisis ranked better than 40th worst in underemployment in any year between 2003 and 2012 (Figure 3).
Best Performing States
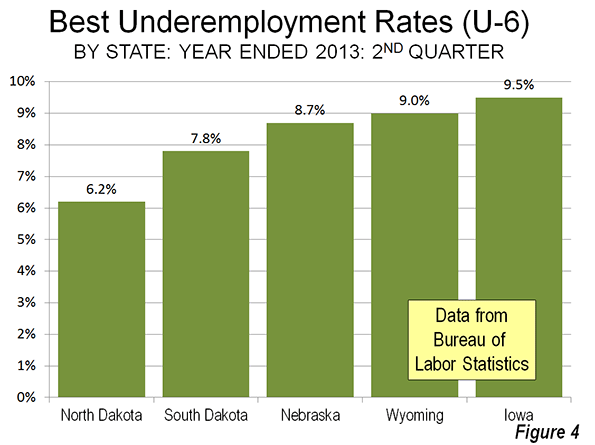
The best underemployment rates were literally concentrated in five adjacent states with strong energy sector states, principally in the Great Plains. North Dakota led the nation for the year ended June 30, 2013, with an underemployment rate of 6.2 percent, less than one-half the national rate (14.7 percent) and less than one-third the rates of Nevada and California. North Dakota’s neighbor to the south, South Dakota had the second best rate, at 7.8 percent, while Nebraska ranked third at 8.7 percent. On Nebraska’s western border, Wyoming, the only non-Plains state in the top five, ranked fourth with an underemployment rate of 9.0 percent. Nebraska’s eastern neighbor, Iowa, ranked fifth, at 9.5 percent (Figure 4).
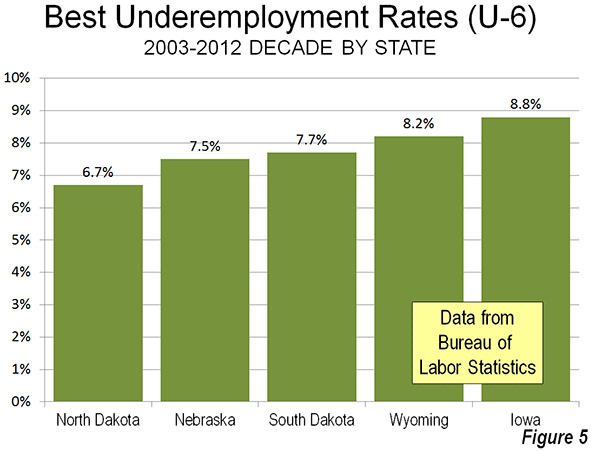
As with the states with the worst underemployment rates over the last decade, those with the lowest current figure also did best from 2003 and 2012. North Dakota is again number one, with an underemployment rate of 6.7 percent. Nebraska (7.5 percent), South Dakota (7.7 percent) and Wyoming (8.2 percent) follow, with New Hampshire ranking fifth best, at 8.8 percent (Figure 5).
Underemployment in New York City and Los Angeles County
For the year ended June 30, 2013, the city of New York had an underemployment rate of 15.1 percent, somewhat above the national rate of 14.3 percent. Over the past decade, the state of New York's underemployment rate has been lower than that of the city in every year.
Los Angeles County is the largest county in the United States and if it were a state would rank eighth in population, between Ohio and Georgia. Further, it Los Angeles County were a state, it would have had the worst underemployment rate in every year from the 2008 to the present. For the year ended June 30 2013, Los Angeles County had an underemployment rate of 20.8 percent, nearly 1/2 higher than the national underemployment rate 14.7 percent and above the highest state rate of 20.3 percent in Nevada.
Closing the Productivity Gap
The productivity gap that results from underemployment constrains the US economy at a time of unusually severe financial challenges. College graduates face not only a grim employment market, but have student loan repayments that require good jobs. The nation continues to spend more than it collects in taxes. The inability of state and local governments to fund their government employee pension programs could lead, in the worst case, to much higher taxes or severe service cutbacks.
Yet things could get worse. The soon to be implemented “Patient Protection and Affordable Care Act” (“Obamacare”) has a built-in incentives for employers to shift workers to part time status (weekly schedule of fewer than 30 hours of work per week). The law exempts them from providing health insurance for employees who work part time and so some establishments are shifting full time employees to part time status. Others establishments may substitute hiring part time employees instead of full time to reduce their expenses. This incentive is not just being executed by private companies seeking to maintain profitability. It extends to state and local government agencies, which unlike the federal government, must balance their books each year. According to a running of enterprises announcing shifts to part-time by Investors Business Daily, more than 75 percent are government agencies.
All of this points to two important policy implications. The first is the necessity of focusing on the underemployment measure, the improvement of which is so crucial to maintaining and improving the standard of living and reducing poverty (by reducing the productivity gap). The second is that, with such a focus, policy makers from Washington to Sacramento, Lansing, and Carson City must pursue policies that encourage investment and employment.
Wendell Cox is a Visiting Professor, Conservatoire National des Arts et Metiers, Paris and the author of “War on the Dream: How Anti-Sprawl Policy Threatens the Quality of Life.
---
Note 1: A detailed comparison of the unemployment (U-3) and underemployment (U-6) rates is provided by economist Ed Dolan. A useful chart comparing the two indicators, with numbers from June 2012 will be found on qz.com.
Note 2: Vedder, Denhart and Robe also suggest the possibility of “over-investment,” as more students may have been encouraged to higher education levels than there are likely to be correspondingly appropriate jobs. The extent of such over-investment is not known.


first of all you have to
first of all you have to give your email and then you can take
brave frontier cheat online from here.
Valuable research on Underemployment in America
great blog post - "Underemployment in America"
let me intoduces a website for email marketing.
"Get Email Marketing Software to create, send & track bulk email campaigns, newsletters, benchmarks & autoresponder with automated detailed reports."
Visit http://icubes.in/index.php
In the United States of
In the United States of America we have witness several possible and impossible happens in recent past years; such as economic crisis; war; world trade center attack; changing politics and many others. Now we are going to witness underemployment issues. Basically we misunderstood the difference in between underemployment and unemployment; but I hope through this article we can get sufficient and essential facts about our questions. day by day the cost of living graph found higher and employment graph fallen down; so we might have face a biggest problem in near future. The below link describes about the difference in between both the facts underemployment and unemployment.
http://stateofworkingamerica.org/great-recession/unemployment-and-undere...