
It is important that traffic congestion be controlled sufficiently to facilitate a more competitive metropolitan economy. Each year, three organizations produce traffic congestion reports, Tom Tom, INRIX and the Texas Transportation Institute of Texas A&M University (TTI). These reports use different methods to estimate the excess time lost in traffic congestion during peak travel periods (morning and evening week day "rush hours").
The excess travel time is estimated relative to the travel time that would be expected if there were no congestion (if all traffic were free flowing). Economists caution that achieving free flow conditions at all times would require excessive investment. Yet, the standard metric used by the three indexes are useful for comparing the intensity of traffic congestion between metropolitan areas even without knowing the level at which economic efficiency is optimized.
There is generally strong correlation between the three indexes, though there are important differences. For example, the TTI report uses data from INRIX, yet agrees with INRIX on only six of the most congested 11 US major metropolitan areas (over 1 million population). The most substantial difference is in San Francisco, which INRIX (and Tom Tom) ranked as the second most congested major metropolitan area, far worse than the TTI ranking of 20th.
The findings from the three traffic congestion indexes are synthesized into a composite congestion index in this article. Because the TTI's latest index is 2011, composite index covers 2011 through 2013 (for methodology, see Note 1).
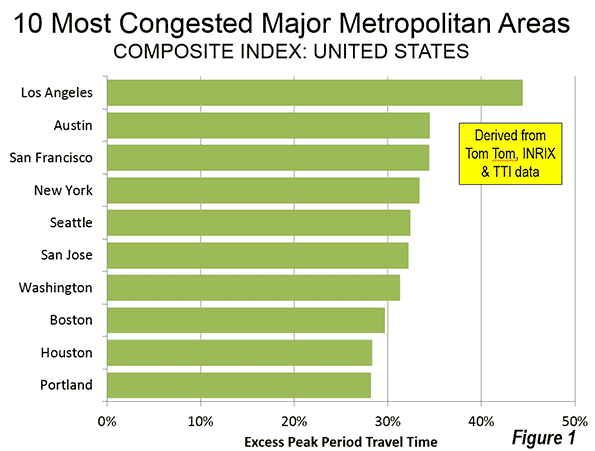
Worst Traffic Congestion in 2011-2013
The "10 worst traffic congestion" list includes some of the largest metropolitan areas, those with the highest urban population densities and a few smaller metropolitan areas with special traffic congestion inducing conditions (Figure 1).
Los Angeles has the worst traffic congestion in each of the three indexes (44.4% excess travel time). This is consistent with the now 30 year history of TTI, which has typically shown Los Angeles to have the worst traffic congestion. This is not surprising, since Los Angeles is the densest urban area in the nation, ahead of second place San Francisco by 10 percent and New York by 30 percent. Traffic congestion has been made worse by cancellation of planned freeways and freeway segments in the Los Angeles area, such as the Beverly Hills Freeway, the Slauson Freeway, the Reseda Freeway, the La Cienega Route 170 freeway, the South Pasadena "missing link" and others (Note 2).
Austin ranked second in traffic congestion (34.5%). This may be surprising, since Austin is not among the largest major metropolitan areas, though it is among the fastest growing. In the middle 1950s, when the final plans for the interstate freeway system were completed, Austin was much smaller and only a single interstate route was justified. Later, opposition to freeway development led to increased congestion. In more recent years the Austin freeway system has been augmented by new toll roads, though roadway improvements have not been sufficient to deal with the rapidly rising demand.
Not surprisingly, San Francisco (34.4%), with the second highest urban density among major metropolitan areas, ranked third in traffic congestion. New York (33.4%), with its higher than average density and dense core area ranked fourth in traffic congestion. Seattle ranked fifth (32.4%), despite its somewhat lower urban density. Seattle's long and relatively narrow north-south urban form and modest north-south freeway capacity is an important contributor to its intense traffic congestion. As in the case of Los Angeles, some planned freeways were canceled, which has also exacerbated traffic congestion.
San Jose is a smaller major metropolitan area, yet has the sixth worst traffic congestion in the nation (32.2%). There are two principal contributing factors, its proximity to much larger San Francisco and the third highest urban density of the major metropolitan areas, 10 percent above New York.
Washington (31.3%) and Boston (29.7%) have the seventh and eighth worst traffic congestion respectively. In each case, core areas have little freeway capacity (in part because of freeway cancellations in both cities).
Houston, which had the worst traffic congestion the nation during the middle 1980s, now ranks much better, at ninth (28.3%). Houston's improvement has occurred because of the roadway expansions opened concurrent with some of the fastest population growth in the high income world over the past three decades.
Portland, like San Jose and Austin is not among the larger major metropolitan areas. Yet Portland ranked 10th in traffic congestion (28.2%). Portland's policies, such as densification, have contributed to this; these include a cancelled freeway and a preference for light rail over highway capacity expansion. According to the TTI index, Portland has seen its peak period congestion ranking rise from 47th worst (out of 100) in the middle 1980s to 6th worst in 2011.
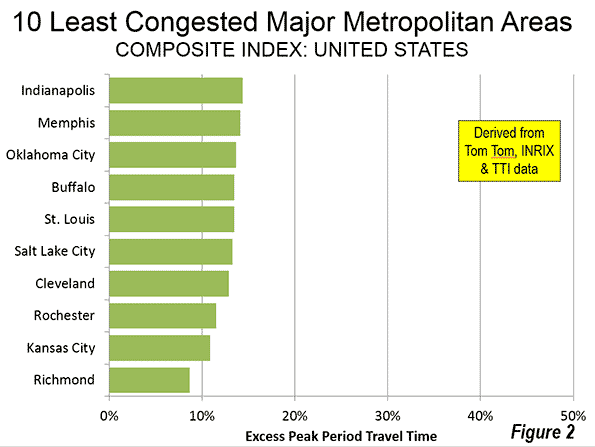
Least Traffic Congestion in 2011-2013
The major metropolitan areas with lower levels of congestion tend generally to be smaller and to have lower urban population densities (Figure 2).
Richmond is the least congested major metropolitan area in the nation (8.7%), and has experienced growth since 2000 that is greater than average. Kansas City had the second least traffic congestion (10.9%), while nearly stagnant growth Rochester (11.5%) and Cleveland (12.9%) ranked third and fourth. Faster growing Salt Lake City ranked fifth (13.3%). Population losing Buffalo ranked sixth (13.5%) edged out seventh ranked and slow growing St. Louis (13.5%). Faster growing Oklahoma City ranked eighth (13.7%), while slower growing Memphis ranked ninth (14.1%). Indianapolis (14.4%), one of the few Midwestern metropolitan areas growing faster than average, has the 10th lowest traffic congestion level.
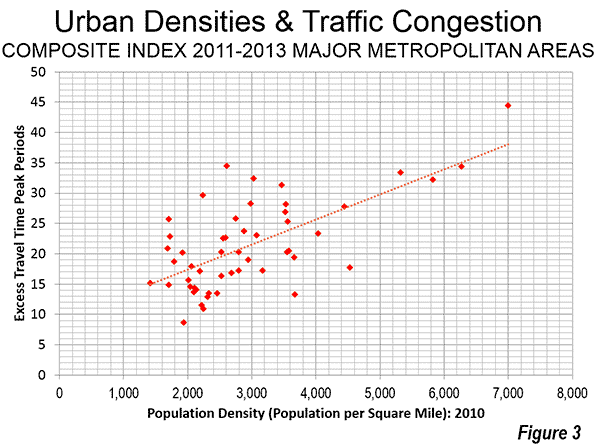
Traffic Congestion and Density
The connection between higher levels of traffic congestion and higher urban population densities has been documented in various analyses (also here). The traffic congestion index confirms that metropolitan areas with higher urban densities generally have more intense traffic congestion (Figure 3). Obviously, there are other factors that contribute to traffic congestion, not least the insufficient provision of highway capacity. This is evidenced by growing Dallas-Fort Worth and Phoenix, where state and local officials have provided substantial increases in highway capacity. Traffic congestion index shows Dallas-Fort Worth to have only the 16th worst traffic congestion and Phoenix to have the 33rd worst traffic congestion (out of the 52 major metropolitan areas). Greater employment dispersion can also be an important factor. The data for each of the major metropolitan areas is in the Table.
| Composite Traffic Congestion Index: 2011-2013 | ||
| Excess Travel Time: Peak Periods | ||
| Rank | Metropolitan Areas | Index |
| 1 | Los Angeles | 44.4 |
| 2 | Austin | 34.5 |
| 3 | San Francisco | 34.4 |
| 4 | New York | 33.4 |
| 5 | Seattle | 32.4 |
| 6 | San Jose | 32.2 |
| 7 | Washington | 31.3 |
| 8 | Boston | 29.7 |
| 9 | Houston | 28.3 |
| 10 | Portland | 28.2 |
| 11 | Miami | 27.8 |
| 12 | Chicago | 26.9 |
| 13 | Philadelphia | 25.8 |
| 14 | Atlanta | 25.7 |
| 15 | Denver | 25.3 |
| 16 | Dallas-Fort Worth | 23.7 |
| 17 | San Diego | 23.3 |
| 18 | Baltimore | 23.1 |
| 19 | Nashville | 22.9 |
| 20 | Minneapolis & St. Paul | 22.7 |
| 21 | Tampa-St. Petersburg | 22.6 |
| 22 | Charlotte | 20.9 |
| 23 | New Orleans | 20.5 |
| 24 | Orlando | 20.3 |
| 24 | Virginia Beach | 20.3 |
| 24 | Riverside-San Bernardino | 20.3 |
| 27 | Pittsburgh | 20.2 |
| 28 | Sacramento | 19.4 |
| 29 | San Antonio | 19.0 |
| 30 | Hartford | 18.7 |
| 31 | Cincinnati | 17.9 |
| 32 | Las Vegas | 17.7 |
| 33 | Phoenix | 17.2 |
| 33 | Detroit | 17.2 |
| 35 | Providence | 17.1 |
| 36 | Columbus | 16.8 |
| 37 | Milwaukee | 16.3 |
| 38 | Jacksonville | 15.7 |
| 39 | Birmingham | 15.2 |
| 40 | Raleigh | 14.9 |
| 41 | Louisville | 14.6 |
| 42 | Indianapolis | 14.4 |
| 43 | Memphis | 14.1 |
| 44 | Oklahoma City | 13.7 |
| 45 | St. Louis | 13.5 |
| 45 | Buffalo | 13.5 |
| 47 | Salt Lake City | 13.3 |
| 48 | Cleveland | 12.9 |
| 49 | Rochester | 11.5 |
| 50 | Kansas City | 10.9 |
| 51 | Richmond | 8.7 |
| Derived from Tom Tom, INRIX and Texas Transportation Institute data | ||
Traffic Congestion and Economic Growth
While there are different interpretations of the appropriate standard for traffic congestion, there is no question but that less traffic congestion benefits a metropolitan area's competitiveness. Because traffic congestion increases travel times, it necessarily reduces the share of a metropolitan area's (labor market) jobs that can be reached by the average employee. A considerable body of research associates greater access (measured in time) with improved economic performance and job creation.
-----
Note 1: The 2011 – 2013 index represents the average excess travel time estimate of the three sources. For each source, each metropolitan area's excess travel time is converted to a percentage of the metropolitan area with the worst excess travel time. These percentages are then averaged and the final excess travel time estimate is calculated by applying this percentage to the average worst excess travel time for the three sources. But these estimates are based on the TTI travel time index, and the peak hour excess travel time percentages from INRIX and Tom Tom (the Tom Tom figure is obtained by averaging data from the morning and evening peak period).
Note 2: I have a personal attachment to the Long Beach Freeway "missing link" in South Pasadena. In the early 1960s my great aunt and her husband were forced to sell their home taken to the California Highway Department for the imminent construction of the roadway. This was the beginning of a decades-long fight to keep the freeway from splitting the city of South Pasadena. In the early 1980s, as a member of the Los Angeles County Transportation Commission I was appointed to a special committee chaired by County Supervisor Peter F. Schabarum to make a final route selection between the Caltrans "Meridian" route and the South Pasadena preferred "Westerly Route." Our decision, the result of submittals and hearings, confirmed the Caltrans route, but did nothing to alleviate the South Pasadena opposition. Now, there is the possibility of building a tunnel, which would minimize surface disruption.
----
Wendell Cox is principal of Demographia, an international public policy and demographics firm. He is co-author of the "Demographia International Housing Affordability Survey" and author of "Demographia World Urban Areas" and "War on the Dream: How Anti-Sprawl Policy Threatens the Quality of Life." He was appointed to three terms on the Los Angeles County Transportation Commission, where he served with the leading city and county leadership as the only non-elected member. He was appointed to the Amtrak Reform Council to fill the unexpired term of Governor Christine Todd Whitman and has served as a visiting professor at the Conservatoire National des Arts et Metiers, a national university in Paris.
Photo: Richmond (major metropolitan area with the least traffic congestion) by CoredestayChiKai


Job Accessibility
Interestingly, the list of cities ranked by job accessibility by auto looks almost exactly the same:
Top 10 accessible metro areas (2010)
Los Angeles
San Francisco
New York
Chicago
Minneapolis
San Jose
Washington, D.C.
Dallas
Boston
Houston
http://www.cts.umn.edu/Research/featured/access/
Traffic Congestion
In reading the article re: the traffic congestion I find a not so subtle bias re: the need for and promoting new highway construction by the often stated cancellation of proposed highways in the regions as being the culprit to the problem.
Traffic congestion is far more complex than highways or the lack of them. Building more freeways or adding lanes does not do much beyond a short horizon fix to the problems incurred by development, increased density, and the lack of affordable housing in relation to work place and the location of the available workforce.
Issues should be discussed in a greater overall context of transportation and development patterns in identifying problems and solutions.
Los Angeles metropolitan region is not dense by any means of the word but it is very horizontal and uses much greater amounts of land per capita than most regions. And yet it lacks any comprehensive plan for transportation beyond that of freeways.
LA once had a rail system with 5000 miles of track but the car destroyed that. The car gives one the freedom of individual choices but also enslaves us to the freeway solution and a life of commuting.
It is the lack of density and the suburbafication of the region that has made it more difficult and costly to develop an effective mass transportation system that might ultimately relieve congestion.
I am only an architect and not a transportation specialist but I see the patterns we have built and continue to develop as being problematic and the transportation or lack of is a part of the puzzle.
I must also wonder if there is not some financial support by the hi-way construction industry that is funding these annual studies merely as a means of securing more funds from the government tax dollars to build more hi-ways?
I am not against development as I obviously need that in my own field to build my designs, but I also feel these kind of issues should be addressed in a more comprehensive manner to improve our lives through sustainable solutions and not merely a continuation of the status quo.
Christopher
That pesky "maximum flow versus maximum speed" thesis
It is interesting that critics of these measures of congestion, such as Todd Litman, argue for the use of measures "relative to maximum flow" rather than relative to maximum speed.
Litman has mounted endless alleged "rebuttals" of Rubin and Mansour's paper on Transit and Congestion, part of which "rebuttal" involves inferring that if congestion was "correctly measured" the results would be different. This is nonsense. It does not matter what base you are measuring congestion from; if no reduction could be found under the actually used measure, it means there is no reduction, period.
Furthermore, my argument has often used TomTom congestion delay comparisons such as Auckland NZ versus Indianapolis USA. My argument is that Indianapolis is about 1/3 Auckland's density, has around 3 times as much highway and arterial road lane-miles, has house price median multiples around 1/3, and has congestion delays around 1/3 as well. I would like to coin the use of a new term, the "one-third, one-third, one-third, one-third rule".
Now the Litman argument would claim that the results would be different to that obtained under the TomTom measure of 45 minutes delay for Auckland and 15 minutes for Indy, if only the delay was measured from maximum flow rather than maximum speed. It needs to be forcefully pointed out to Litman and Co that the result in the typical case of Auckland versus Indy, is a likely congestion delay comparison of 35 minutes for Auckland versus 5 minutes for Indy.
This does not exactly reinforce the case for starving the local economy of road apace, does it?
How Does Whatsapp Works
In the instance above uses Full -Scene Anti- Aliasing ( FSAA ) . Frankly the entire image is in a spin - antialiased period . Regularly you are able to get different strong points of anti aliasing setting in a game . In the illustration above ( Battlefield 2 ) you're able to select between n one, 2x or 4x FSAA . Anti aliasing has an adverse influence in the performance of the sport . whatsapp422
The important factors no-one seems to think of
There are several factors that add to congestion, and each city with a congestion problem suffers from a different mix of these problems.
Probably the biggest contributor, is the extent of cross-directional traffic conflicts and the way these are managed (grade separation, interchanges, etc). The way the modern city evolves, jobs are dispersed, not centralised, and rush hour traffic tends to be a lot more multi-directional. While radial commuting to a major core involves less cross-directional conflicts (and allows for the use of transit) it actually focuses congestion rather than dilutes it as dispersed travel patterns do. Wellington, the capital city of NZ, is the classic example of a city with an outlier level of centralisation of employment in a single major CBD accompanied by an outlier level of traffic congestion delay especially for a city its size.
The systemic affordability of housing affects efficiency of household locations; the more "pricing out" there is of households below a certain income level from more parts of the urban area, the more forced long commutes there will be - which adds to congestion effects as well as trip distances and times. This is why the UK has the most compact cities in the OECD (for their population) and also the longest average commute times.
The rate of expansion of road system capacity relative to the rate of urban growth is of course very important. Austin's problem is simply that it is growing far faster than its preparedness to build road lane-miles. But it is not purely this simple - radial highways are nowhere near as important to the modern urban form, as a grid of arterials to provide for the travel where it is mostly taking place (which is NOT to and from a single central CBD from the suburbs). But the grid of arterials MUST incorporate good management of the inevitable cross-directional conflicts - mere lane-miles are useless if there are controlled intersections everywhere regardless of which direction you need to travel.
Fred Small et al are confirming in their research that the cost of engineering urban highways for speed, just as if they were going to be used for Interstate travel, is an inefficient use of money, because most travel on them is congested, low-speed conditions. The same money spent on cheap lane-miles, narrower, non-elevated, following the contours of the land where this is more cost-effective; gets a LOT more lane-miles for the money, and less congestion delay at peak (provided the cross-directional traffic conflicts are well managed).
Of course planners fetish these days for transit, is obstructing the adoption of what is obviously the most efficient form of integrated transport planning, because dispersion of employment is inimical to transit efficiency. But dispersion of employment, systemic housing affordability and maximum co-location opportunities maximise opportunities for walking and cycling, which at least do not cost the taxpayer anything. The potential for these are probably at least equivalent to that for transit in most cities; ironically transit oriented planning, because of the effect of concentrations of jobs and "pricing out" of people according to their ability to pay, eliminates the option of efficient co-location, and hence walking and cycling, for most people. "TOD" nodes are nice choices for wealthy yuppies only, and inherently "de-democratize" the choice of efficient co-location and walking and cycling.
Questions
Why is Sacramento listed twice?
I don't get Las Vegas. There is no rush hour in that city. As long as you stay off the strip, you can get anywhere you want to go, quickly.
I've lived in and around both Buffalo and Indianapolis, and have also spent a fair amount of time in Las Vegas. I can tell you I've spent a lot more time in traffic in the other two cities than in LV.
Vegas is a special case, to be sure. I doubt the metrics used for other cities apply very well. And I confess that in Vegas I typically stay off the Interstate. The surface streets are very convenient and fast. There are no bottlenecks, and always multiple routes between here and there.
Somewhat off topic, but here's an article about Las Vegas: http://trotskyschildren.blogspot.com/2013/07/why-trotskyists-dont-like-l...
Thank you for sharing your opinion
Your post had provided me with another point of view on this topic. I had absolutely no concept that things can easily work on this way as well. Thank you for sharing your opinion