It was the best of times, it was the worst of times; it was the age of wisdom, it was the age of foolishness; it was the epoch of belief, it was the epoch of incredulity; it was the season of light, it was the season of darkness; it was the spring of hope, it was the winter of despair.
Charles Dickens, A Tale of Two Cities
Since 1790, 273 cities have made an appearance on the list of the nation’s 100 largest places.
Cities of all shapes and sizes have made the list at one time or another - ranging from New York, which has held the top spot in every single census from the very beginning; to little Chillicothe, Ohio, which appeared once in 1830, at #87, and never made the list again.
Examining this list decade-by-decade is instructive, for it largely tracks the entire history of the nation’s settlement patterns - from the initial cultural hearths of Yankee New England and Tidewater Virginia; through the river and canal era; the railroad era; the industrial era; the interstate highway and suburban era; to the decline of the Rust Belt, and the triumph (for the time being) of the Sunbelt - and beyond.
The list tells the story of the relative decline of many cities - places like Providence (1790-1980); Dayton (1830-1990); and Des Moines (1880-2000), which were ranked in the top 100 for decades, have shrunk to one degree or another, and eventually fell off the list, but remain significant-sized urban centers today.
It also tells the story of the absolute decline of many cities - places like St. Louis, Detroit, Buffalo, Pittsburgh, and Cleveland - formerly huge cities that all once ranked in the top 10, which have now lost over half of their population. All five of these cities remain in the top 100, but they are all suffering from the seemingly intractable problems that come with massive abandonment and disinvestment - fiscal instability, poverty, inequality, and a frayed civic and social fabric. Here in 2014, their collective future, especially in their current form, is increasingly uncertain.
And that - looking toward the future - is why this topic is truly important. Examining this information is about far more than a trivial jaunt down memory lane. What does it tell us about the future of our cities?
For one, there is this question: Does any of this even matter?
Is the size of our central cities even important? Aren’t city boundaries arbitrary and meaningless? Isn’t it the surrounding metropolitan region that really counts?
Well, it’s a complicated story. For years, pundits, prognosticators, and policy wonks have been telling us that the age of the central city is over; that it is the region that is important. Economies are based on regional job markets, they say, and improvements in transportation and communications are making local places (even large ones) increasingly irrelevant.
The fact that economies are regional is true - as far as it goes. But like anything viewed through one lens only, it does not tell the whole story.
Are regions important? Of course. But so are places. Like so many other things in the realm of urban public policy, this is not a binary, either/or, choice.
Indeed, at the same time that we are being told by one set of pundits about the irrelevance of our cities, we have another set of pundits telling us that this is, in fact, a new golden age for our cities.
Cities entered a long cyclical downturn following World War II, they tell us, but they are now on the rebound, and are experiencing an unparalleled renaissance. Property values are increasing, Millennials are moving to our downtowns, and previously declining neighborhoods are coming back to life, replete with upscale shops, bistros, and pubs.
But this doesn’t tell the whole story, either. For every gentrifying formerly shrinking city like New York, Washington, and San Francisco, and for every sprawling boom town like San Jose, Charlotte, or Columbus; there is a St. Louis, a Cleveland, and a Detroit; and there is a Gary, a Flint, and a Youngstown.
What does the future hold for these cities? What about the giant places full of the mind-boggling, post-apocalyptic decay and dysfunction that comes with literally losing one million residents, like Detroit?
And what about the mid-sized places, like Flint, that may not have the assets or the resources to ever turn the corner. Will they continue to die a slow, agonizing death, and literally disappear? Or will they continue on in a shadow-form, serving as a cautionary tale, and inhabiting some type of uniquely American, urban equivalent of purgatory?
Or can they be restored - if not, perhaps, to their former glory, to at least something that is stable, equitable, and workable for those that remain?
This post is full of more questions than answers. It is an inherently complicated topic.
Big Questions for the Rust Belt
While it is true that cities have grown and declined (and sometimes grown again) throughout American history, it is also true that we have never before experienced the unprecedented population decline that some of our largest cities have experienced over the past 60 years, especially those in the Rust Belt.
Rust Belt cities have experienced the triple whammy of structural economic decline (the outsourcing of manufacturing); continued regional outmigration (to the Sunbelt); and continued suburbanization (in a region with a strong tradition of local government and a deep antipathy toward consolidation). All three of these things make the shrinkage of its cities unique, from a historic standpoint.
When a large city loses over half of its population, whether that equates to one million people (Detroit); 500,000 people (Cleveland); or 100,000 people (Youngstown), there are very real consequences for the very real residents that remain. Even if these particular cities were experiencing widespread regional prosperity and economic growth (they are not), it would not fundamentally change the social and economic reality for city residents living with the consequences of widespread abandonment in these places.
Regardless of what some advocates of regionalism might say, city boundaries are not arbitrary and meaningless. Although some may claim that shrinking cities are no big deal as long as the metropolitan region overall is growing, central cities will continue to profoundly matter, especially to the people (often disproportionately poor) that remain.
Municipal boundaries are not irrelevant, whatever the regionalists may tell you. Economies may be regional, but in most of the nation’s fastest declining cities, government is not. Municipal boundaries affect taxation, land use policy, public safety, education, public infrastructure, and the delivery of social services.
When a city’s population declines precipitously, the proportional demand for the public services that it provides shrinks less than its population, with the end result that its residents end up paying more in taxes, for less in services. Even if this were not the case, it is expensive and (politically speaking) exceedingly difficult to scale-back and shrink long-term capital investments in public infrastructure – as “shrinking cities” like Detroit and Youngstown have discovered.
What goes on within a given city’s actual municipal boundaries has incredibly important ramifications for its tax base; its employment base; the performance of its schools; the distribution of everyday amenities like grocery stores, shops, and restaurants; the delivery of public services; and less tangible, but equally important things like its sense of place and its sense of itself. As cities are abandoned, decline, and become hollowed out, access to social and economic opportunities diminishes along with the population: the jobs disappear, the doctor’s offices disappear, the grocery stores disappear – relocated, often, to a distant and increasingly inaccessible locale. To pretend as though the economic and social well being of city residents is not directly impacted by population decline is to turn a blind eye to reality itself.
But it is not just city residents that are affected by decline. The health of the entire region suffers as a result. The shrinking tax and resource base of City “A”, is not simply counteracted by economic growth in nearby cities “B” and “C”. In a region anchored by a declining central city surrounded by dozens of separate municipalities, the redundant duplication and proliferation of local government services (education, public safety, public utilities, transportation infrastructure, social services) ends up costing all taxpayers more.
The worst-case scenario is a shrinking central city and a shrinking region with an overall population decline, coupled with continued central city abandonment and continued outward expansion. In a region like this, there is not only more costly “stuff” (redundant public services and physical infrastructure) than there needs to be, but there is more “stuff” with ever fewer taxpayers to pay for it.
And while the conventional wisdom may be that regional, not local, economies are what matter, it is important to understand that regions comprised of dozens of separate local jurisdictions do not typically behave very effectively as “regions”. It is not impossible for them to do so, but it is exceedingly difficult.
So why don’t we just go ahead and combine everything? Problem solved, right?
Not so fast.
It has always been interesting to me that the Sunbelt is the region of the country that tends to have the fewest number of local governments, the most liberal annexation laws, and is home to most of the cities that have undergone major city/county consolidations (such as Jacksonville, Nashville, Augusta, Lexington, and Louisville).
This wasn’t always the case. Philadelphia consolidated with its neighboring suburbs (some of the largest cities in the country at the time) in 1854, and New York City did the same thing (merging with Brooklyn – then the nation’s 4th largest city, and the other three boroughs) in 1898.
From a public policy standpoint, most of the South and the West is typically regarded as “conservative”; while much of the Northeast and Midwest is viewed as “liberal”. In this stereotypical telling of the tale, conservatives are supposed to belaissez-faire in terms of urban planning and public policy and are supposed to reflexively favor the local over the regional.
Yet it is precisely in the “conservative” South and West where the people have been most willing to change the model of government and public service delivery to align with modern social and economic realities. Effective government and accountability is still viewed as extremely important, but voters have recognized the benefits of having less duplication and more efficient delivery of services, as well as the regional cohesion and political power that annexation and consolidation can bring with them.
Urban development patterns and public policy decisions on infrastructure are often different in the Sunbelt as well – especially in the West. New development tends to be denser and more compact than it does in the Rust Belt. Not many people know that “car crazy” Los Angeles is actually the most densely populated urban area in the United States, or that “sprawling” Las Vegas ranks 10th. The Los Angeles “suburb” of Santa Ana is twice as densely populated as the “city”of Cleveland.
Some of this has to do with the fact that scarce water supplies don’t allow for scattershot suburban development, and some of it has to do with an increasingly urban ethos that has evolved, especially in California, over the past 50 years. Cities and urban residents are not viewed with the same degree of mistrust, suspicion, and disdain that they are viewed with in the Rust Belt.
So, the Sunbelt is usually posited as an economic success story, especially in comparison with the Rust Belt.
But the questions remain: Was it due to less duplication of local government? Was it in spite of it? Or did it have nothing to do with it one way or the other?
No one really knows for sure.
There is little doubt in my mind that some of the reason for the growth and economic prosperity of Sunbelt cities, and for the corresponding decline of Rust Belt cities, is the failure of most Rust Belt cities to adjust their local government paradigms to reflect modern economic realities.
One only need contrast Cleveland with Columbus, or Detroit with Indianapolis to at least get a general sense of the divergent paths that several pairs of Rust Belt cities have taken, and to make some general comparisons between their regional economic outcomes.
But, these comparisons are not “apples to apples”, either, and it is extremely problematic to claim that the key to Columbus’ economic success (in comparison with, say, Cleveland) has solely been due to its aggressive annexation of nearby communities.
But, with Columbus sitting as the 15th largest city in the U.S. today, and continuing to attract new residents, and with Cleveland dropping from 5th to 45th, and continuing to lose population, it is probably fair to say that it had something to do with it.
If Rust Belt cities had annexed or consolidated with surrounding communities earlier, they would be larger and more cohesive today, and it is probably fair to say that they would have more political clout at the state and national level. They also could have been better positioned to shape how their surrounding regions grew – into something denser, more compact, more cohesive, and less duplicative of public services and infrastructure.
Could have, would have, should have. That horse has largely left the barn.
Today, it is a fair question to wonder how effective (never mind politically feasible) it would actually be to retroactively superimpose the Sunbelt model upon Rust Belt cities. Making Buffalo look and function like Charlotte, on paper, would be very different from making it look or function like Charlotte, in reality.
In most Rust Belt cities today, the fact of the matter is that the incoherent and incohesive development patterns have already occurred, the infrastructure has already been duplicated, and the social and economic mismatches and inequities already exist.
These problems need to be addressed, but clumsily imposing a model that has appeared to work throughout much of the Sunbelt, without taking the time to understand how it would work here, might not be the answer for our region. It might just be trying to force a very ineffective square peg into a very politically infeasible round hole.
So, what will the future hold for our cities? How can we knit them and their surrounding regions together to create an effective, politically feasible, governing framework that works for all of our residents, rich and poor, black and white, urban and suburban?
I don’t know, but I know that it has to do with starting small, working on fundamentals, building trust, inspiring hope, and building authentic relationships between real people.
It is the urban policy question of the 21st Century in the Rust Belt, and it is something that urban advocates, political leaders, policy wonks, and everyday citizens will need to grapple with for the rest of my lifetime.
Now, for the Maps…
The maps below tell the story of how the 100 largest U.S. cities have changed decade-by-decade since the first census in 1790. Please note that only cities over 2,500 are included, so several of the maps from the earliest census years show less than 100 cities. The 10 largest cities in each census year are labeled.
Due to the scale of these maps, Alaska and Hawaii are not shown (Honolulu and Anchorage both rank in the top 100 today).
Below each map you will find a short description of some of the historic, demographic, economic, and transportation trends that were in play at the time of each census. I have also included a breakdown of how many cities in each region of the country ranked in the top 100.
For more detailed information on the 100 largest cities, census-by-census, please click here.
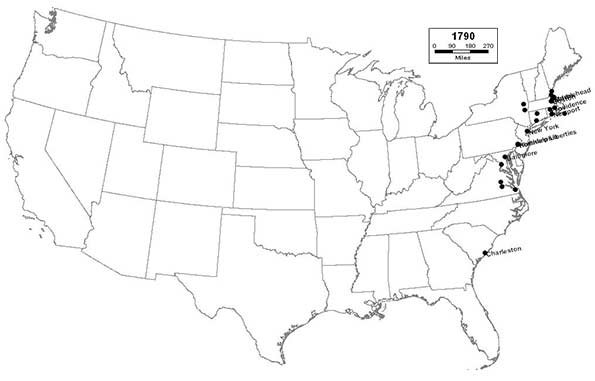
1790 - Northeast (18); Midwest (0); South (6); West (0)
In the immediate aftermath of the American Revolution, all of the the largest cities are concentrated along the eastern seaboard. At the time of the first census, New York City ranked as the nation’s largest - a title that it will go on to hold for the next 220 years; and likely - in perpetuity. Philadelphia, Boston, Charleston, and Baltimore round out the top five.
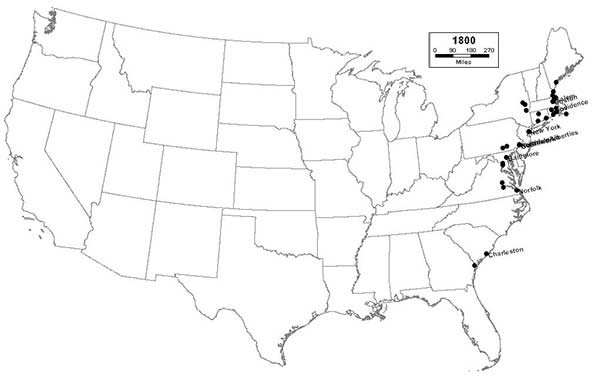
1800 - Northeast (24); Midwest (0); South (9); West (0)
As the 19th Century dawns, the largest cities continue to be clustered along the eastern seaboard as the brand-new nation begins to expand slowly inland. The nation’s new capital, Washington, D.C., joins the list, ranking 31st.
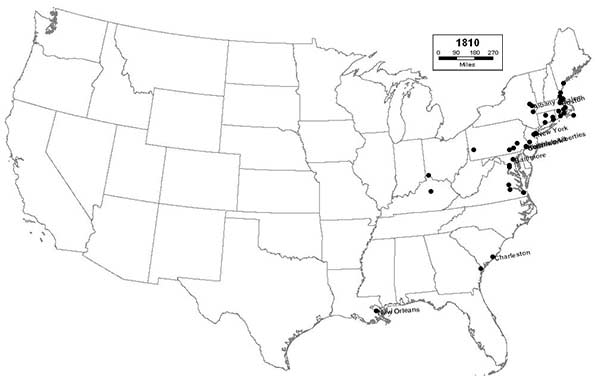
1810 - Northeast (34); Midwest (1); South (11); West (0)
This census marks the beginning of the era of ascendance for the great inland river cities, such as New Orleans, Pittsburgh, and Cincinnati. These cities will serve as key centers of trade and commerce as the interior frontier of the new nation begins to be settled.
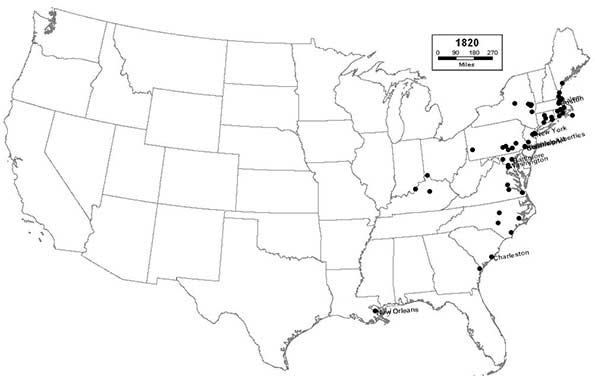
1820 - Northeast (43); Midwest (1); South (17); West (0)
The inland river cities, like Louisville, continue to grow and expand. The importance of waterways increases further as the canal era dawns, literally putting places like Utica on the map.
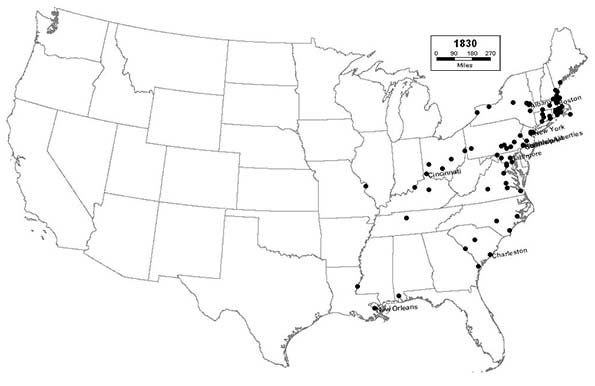
1830 - Northeast (59); Midwest (6); South (25); West (0)
Places throughout the industrial northeast, especially in New England, now firmly dominate the list of the nation’s largest cities. The canals throughout New York, Pennsylvania, and Ohio begin to spur new settlement and industry in places like Buffalo, Rochester, and other smaller cities immediately west and east of the Appalachians. The river cities continue to grow rapidly, as Cincinnati enters the top 10, and St. Louis joins the list.
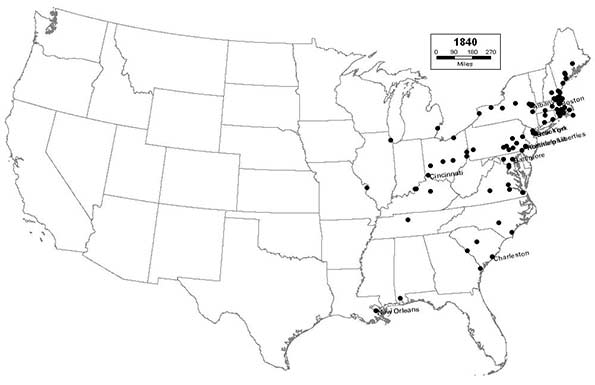
1840 - Northeast (67); Midwest (10); South (23); West (0)
The Great Lakes region begins to develop, thanks to the canals, as Detroit, Cleveland, and Chicago join the list. This region will begin to serve as a staging area for the people and goods needed to develop the areas west of the Mississippi. The Northeast, bolstered by new immigrants from Ireland, remains the urban heart of the nation.
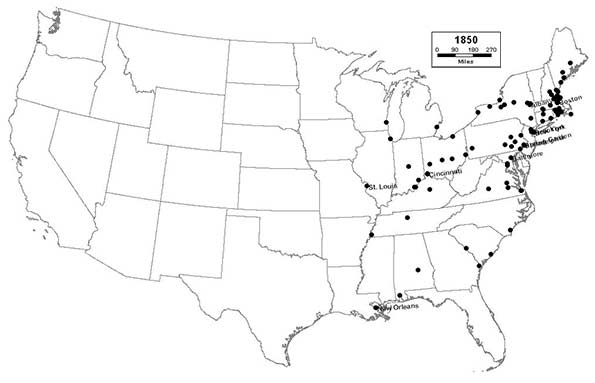
1850 - Northeast (64); Midwest (12); South (24); West (0)
The canal system reaches its mature peak, as strategic locations on the Great Lakes and inland rivers and canals, such as Milwaukee, Memphis, and Syracuse flourish. St. Louis enters the top 10. The relative importance of the eastern seaboard begins to diminish, especially in the South, as the Ohio and Mississippi rivers begin to rival it in importance. Charleston drops out of the top 10 for the first time since 1790.
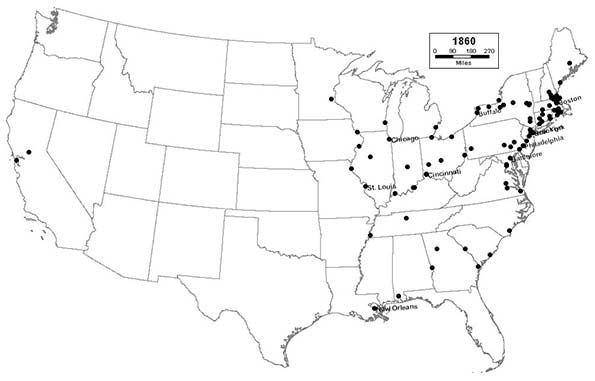
1860 - Northeast (60); Midwest (17); South (21); West (2)
As the Civil War dawns, railroads begin to surpass the canals in importance, as new cities like San Francisco, St. Paul, and Atlanta join the list. The nation’s largest cities will become increasingly dependent upon the railroads for the next 100 years. For the first time, Midwestern cities begin to rival eastern seaboard cities in importance, as Chicago enters the top 10, joining Cincinnati and St. Louis. But the Northeast remains the nation’s urban powerhouse, as Philadelphia consolidates with its neighboring suburban towns to become the nation’s second largest city and New York’s closest, but still distant, rival.
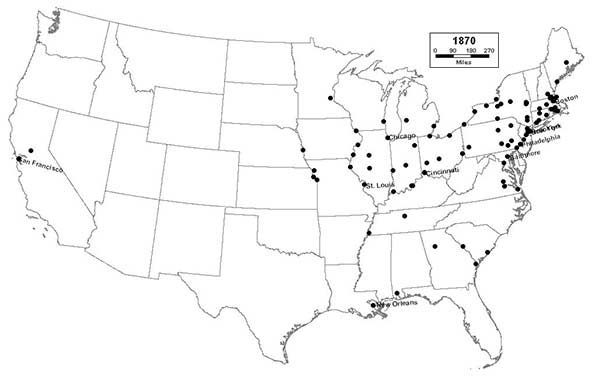
1870 - Northeast (54); Midwest (26); South (18); West (2)
New Midwestern cities like Kansas City, St. Joseph, and Omaha flourish as important gateway railroad terminals from which the Great Plains and the remainder of the West will eventually be settled. The South begins a long period of urban and economic decline following its defeat in the Civil War. The cities of the West Coast begin a period of rapid settlement, as San Francisco enters the top 10.
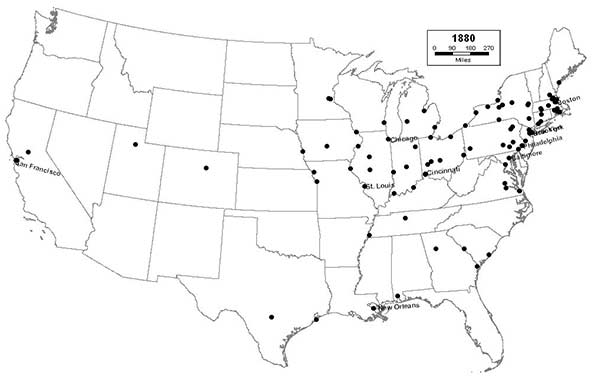
1880 - Northeast (48); Midwest (27); South (20); West (5)
Westward settlement spreads rapidly via railroad across the Great Plains, the West, and Texas, as new cities like Minneapolis, Des Moines, Denver, Salt Lake City, and San Antonio join the list.
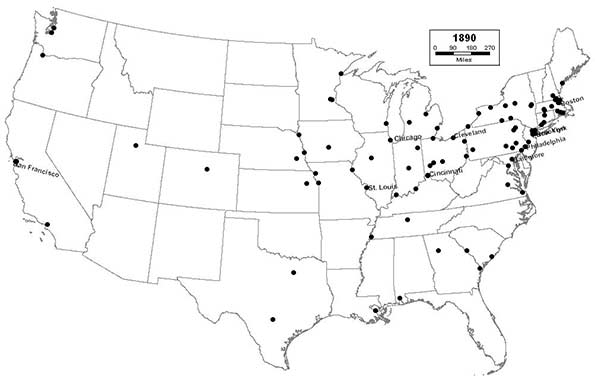
1890 - Northeast (45); Midwest (29); South (18); West (8)
The nation’s manufacturing heartland and industrial base begins to shift from New England to the Great Lakes, as Youngstown join the list, Cleveland enters the top 10, and Chicago surpasses Philadelphia as the nation’s second largest city. The West Coast begins to grow rapidly, as Los Angeles, Seattle, and Portland all join the list, along with Dallas; setting the stage for the eventual domination of the nation’s urban landscape by California and Texas.
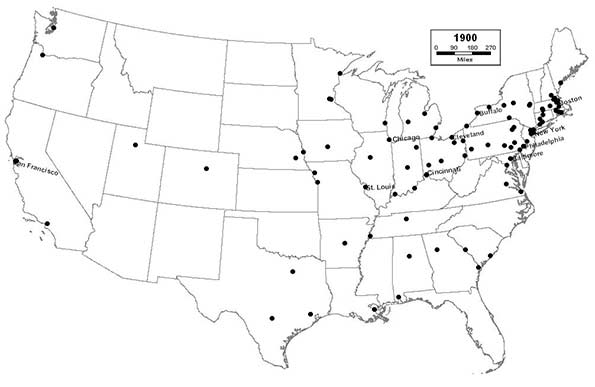
1900 - Northeast (46); Midwest (26); South (21); West (7)
As the 20th Century dawns, after nearly four decades of economic decline, the South turns the corner and begins its economic recovery as new industrial cities like Birmingham and Houston join the list. Mid-sized cities in the Great Lakes region, like Akron, begin to grow rapidly, as a new wave of immigrants from southern and eastern Europe settles throughout this rapidly industrializing part of the country. With railroads now linking the nation from coast-to-coast in several different corridors, the American settlement frontier officially disappears. New York City consolidates with nearby towns and with cross-river rival, Brooklyn, the nation’s 4th largest city, to reach a population of 3.5 million, and achieves unparalleled domination of the nation’s urban hierarchy.
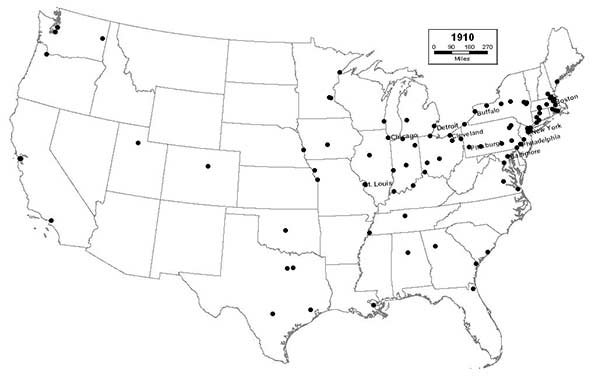
1910 - Northeast (45); Midwest (27); South (19); West (9)
The Great Lakes region continues to thrive as its cities grow larger and more prosperous, and Pittsburgh enters the top 10. Cincinnati drops out of the top 10, but remains a vibrant and expanding urban center. Southern cities, like Fort Worth, Oklahoma City, and Jacksonville join the list, giving Florida a top 100 city for the first time.
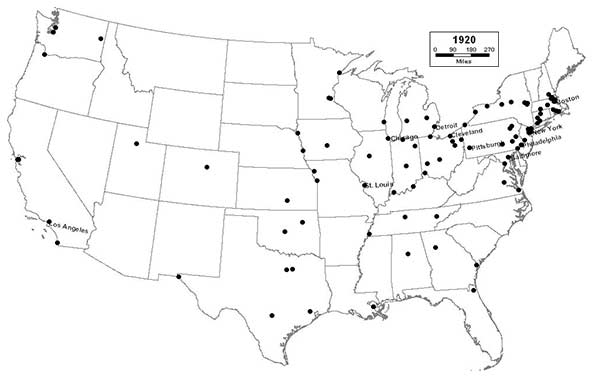
1920 - Northeast (40); Midwest (29); South (21); West (10)
Smaller industrial cities in the Great Lakes region, like Canton and Flint, thrive as the steel and automotive industries explode, and Detroit, “The Motor City”, enters the top 10. Charleston drops out of the top 100 for the first time since 1790. Southern California, poised to eventually become the nation’s prototypical urban region, begins its period of automobile-age ascendance as San Diego joins the list, and Los Angeles enters the top 10.
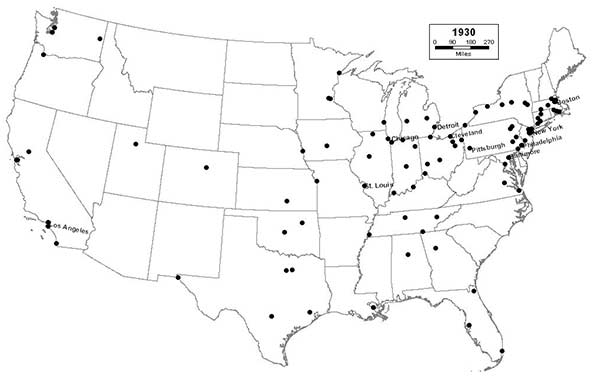
1930 - Northeast (36); Midwest (29); South (23); West (12)
Industrialization in the Great Lakes region reaches its apex in overnight boom towns like Gary, as the region becomes the manufacturing center not only of North America, but of the entire world. The Sunbelt’s period of growth begins in earnest, as cities in California and Florida, like Long Beach, Miami, and Tampa expand rapidly. In contrast, a period of long, steady decline ensues in smaller industrial cities throughout the Northeast, in general, and New England, in particular.
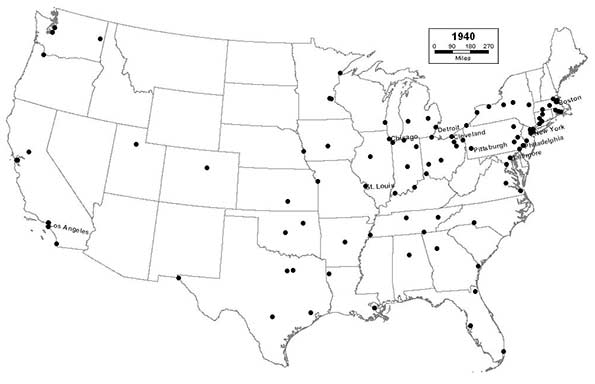
1940 - Northeast (33); Midwest (28); South (27); West (12)
The preceding decade is a difficult one for the nation’s cities. Very few cities grow in the immediate aftermath of the Great Depression. Northern industrial cities are hit particularly hard, but some southern cities, like Charlotte, begin to flourish.
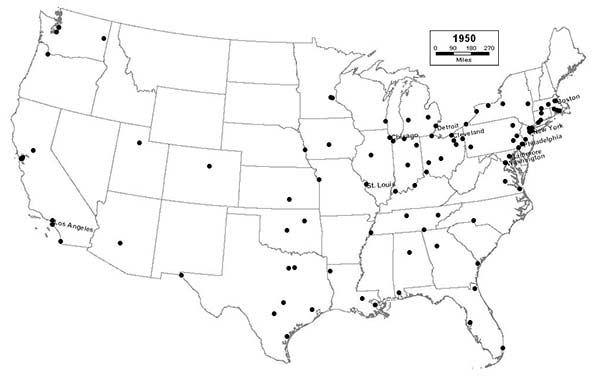
1950 - Northeast (28); Midwest (27); South (31): West (14)
For the first time, the South surpasses the Northeast as the region with the most cities in the top 100, as Austin and Baton Rouge join the list. Pittsburgh drops out of the top 10, as industrial decline in the Northeast accelerates after a brief uptick during the war. Washington, D.C. enters the top 10, due in large part to the expansion of the federal government during the Great Depression and World War II. Phoenix joins the list at #99, presaging the rapid development of the desert Southwest in the coming decades; a small desert crossroads at the beginning of the 20th Century, it will end the century as the nation’s sixth largest city.
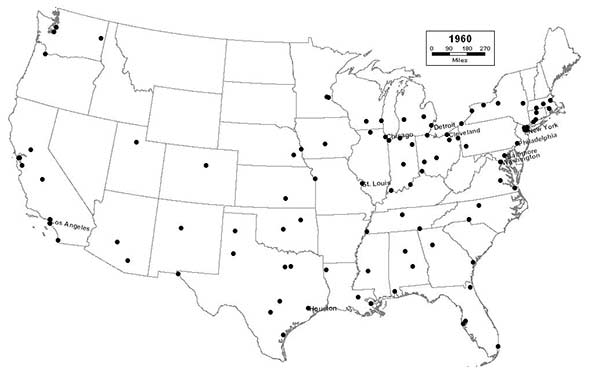
1960 - Northeast (19); Midwest (28); South (35); West (18)
Both suburbanization and deindustrialization become major factors in central city decline, especially in the North, where major cities are hemmed in by adjacent cities and towns, and are therefore unable to expand via annexation. The long tradition of town, borough, and township government throughout the entire North stymies efforts to consolidate governments into units that better reflect modern realities. Boston drops out of the top 10 for the first time since 1790. The expansion of the Interstate Highway System takes its toll, especially on mature Northern cities, by opening up outlying areas for suburban development, and by displacing business and residents in the urban core. Most cities throughout the Midwest have now reached both the peak of their population and their industrial development. In the coming years, they will increasingly follow the pattern established in the Northeast 30 years earlier, as the region begins to transition from the “Great American Manufacturing Belt” to the “Rust Belt”. In contrast, the Sunbelt continues to enjoy explosive growth, as Houston enters the top 10, and San Jose, Tucson, Albuquerque, and Honolulu join the list.
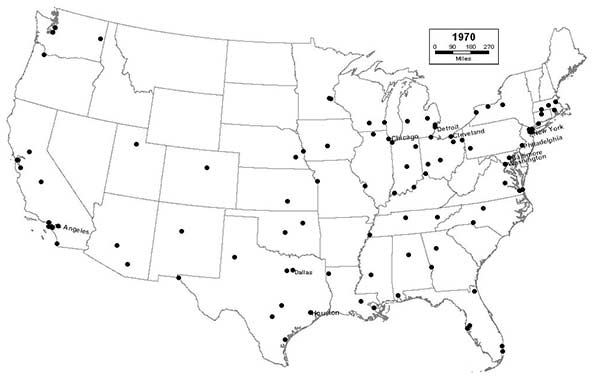
1970 - Northeast (16); Midwest (28); South (35); West (21)
Anaheim, Santa Ana, and Riverside join the list, as Southern California continues to attract new immigrants, both foreign and domestic, in record numbers. The largest Southern and Western cities continue to grow even larger, as Dallas joins the top 10. The industrial Midwest begins to experience a period of rapid decline, as St. Louis drops out of the top 10.
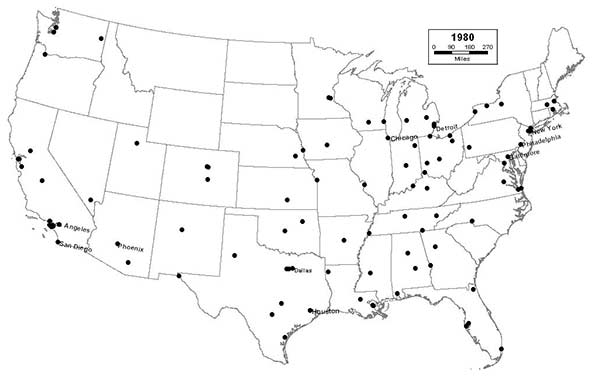
1980 - Northeast (12); Midwest (24); South (38); West (26)
Colorado Springs and Las Vegas join the list, as the interior West continues to grow rapidly. The growth of the West extends to Alaska, as Anchorage makes the list for the first time. Even the suburbs of sunbelt cities, like Arlington, Texas, and Aurora, Colorado begin to surpass established Northeastern and Midwestern central cities in population. San Diego and Phoenix join the top 10. Midwestern cities continue to deindustrialize rapidly, and begin losing population at a truly alarming rate. Suburbanization, white flight, and the inability to annex or consolidate with outlying areas make the problem of industrial decline even worse, as Cleveland drops out of the top 10.
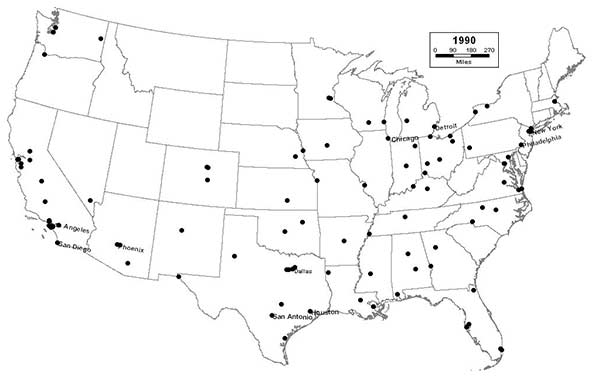
1990 - Northeast (9); Midwest (21); South (40); West (30)
Cities throughout the Sunbelt continue to grow in size, prominence, and influence, as Los Angeles surpasses Chicago as the nation’s second largest city. Three of the nation’s 10 largest cities are now located in Texas, as San Antonio joins the top 10. Sunbelt “boomburbs” continue to explode as cities like Mesa, Arizona; Garland, Texas; and Fremont, California join the list, displacing older eastern cities like Syracuse, Worcester, and Providence, which drops out the top 100 for the first time since 1790.
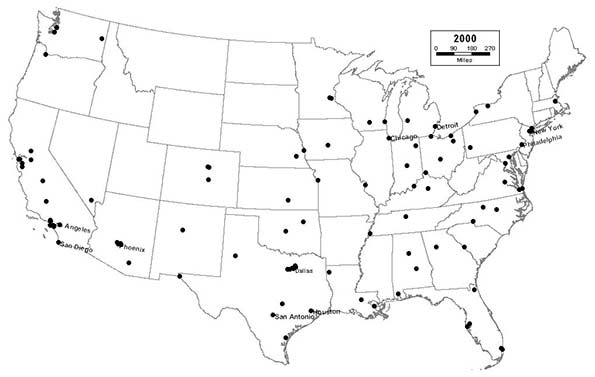
2000 - Northeast (9); Midwest (20); South (40); West (31)
The previously established patterns of Rust Belt decline and Sunbelt expansion begin to stabilize, although many Rust Belt cities continue to lose population at an alarming rate. Dayton drops out of the top 100 for the first time since 1830. Sunbelt boomburbs continue to grow rapidly, as Plano, Texas; Glendale, Arizona; Scottsdale, Arizona; and Irving, Texas all reach the top 100.
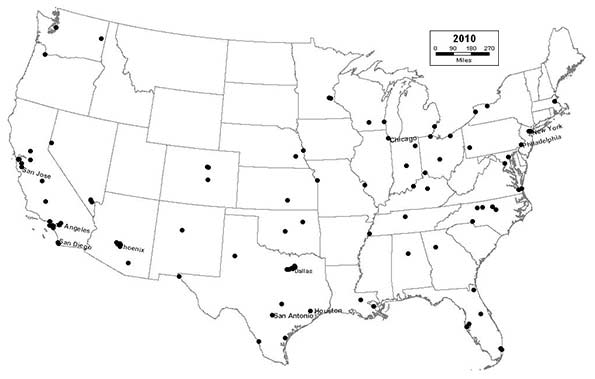
2010 - Northeast (8); Midwest (17); South (39); West (36)
The Sunbelt achieves complete dominance of America’s urban landscape, as 6 of the nation’s 10 largest cities are now located in California and Texas. Rust Belt cities like Cleveland, which experienced a slight respite from decline throughout the 1990s, begin a new period of free-fall, as the housing market collapses in the late 2000s. Detroit drops out of the top 10. Akron drops out of the top 100. Sunbelt cities continue to eclipse their Rust Belt counterparts, as Reno, Orlando, Winston-Salem; Henderson, Nevada; Chula Vista, California; and Irvine, California all reach the top 100.
This post originally appeared in Jason Segedy's Notes From the Underground on April 14,, 2014.
Segedy is the Director of the Akron Metropolitan Area Transportation Study, the Metropolitan Planning Organization serving Akron, Ohio. As a native of Akron, and as an urban planner, he has a strong interest in the future of places throughout the Great Lakes region, and in the people that inhabit them.


