
One unique aspect of Baltimore is that it is a so-called “independent city” that is not part of any county. Because of this, migration data from the IRS allows us to look specifically at the city of Baltimore. So I wanted to take a quick look at migration between Baltimore and its suburbs.
As you might expect, there’s been a net outflow of people from the city for quite some time. From 1990 to 2011 (the most recent year the IRS has released), Baltimore lost almost 151,000 people on a net basis to its suburbs. Here’s the chart:
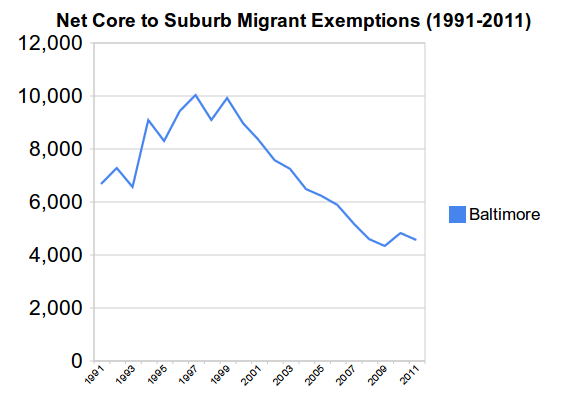
You see here that Baltimore had an accelerating net loss of people, but then showed a steep drop in net loss through the 2000s. This is consistent with county level migration I’ve seen in other regions.
When people leave, they take their money with them. Baltimore’s cumulative net loss of annual income to its own suburbs from departing residents is about $2.75 billion from 1992 to 2011. (Income data isn’t available for 90-91 and 91-92 movers). That’s annual income, so this loss in effect recurs every single year. That’s a lot of money. Here’s the chart on adjusted gross income loss (in thousands of dollars):
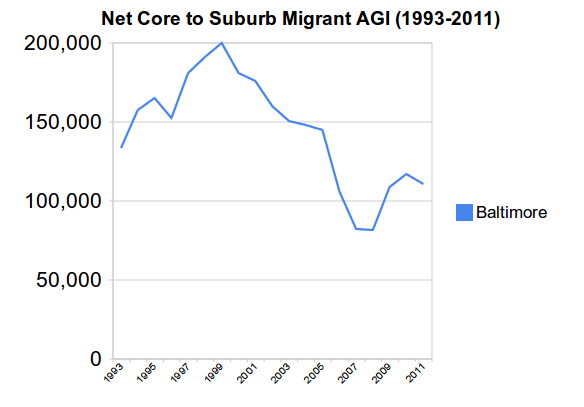
What was a small post-recession bump in the people numbers is a more sizable one in the money figures.
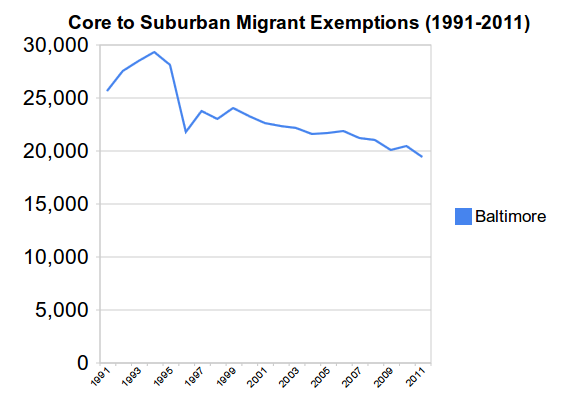
Since we can, let’s also look at the individual flows of people leaving and people coming in. Here are people moving from Baltimore to the suburbs:
And here are people moving from the suburbs to the city of Balitmore – and yes, lots of people do that:
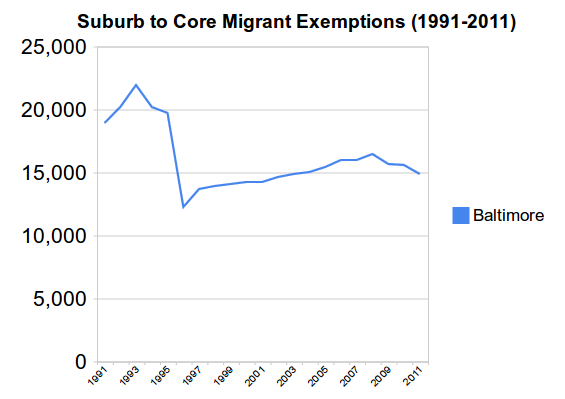
Here we see that the decline in Baltimore’s net loss was driven both by a decline in the number of people leaving and by an increase in the number of people coming in. This is similar to what I’ve seen in other similar places. The uptick in the recession is due to a drop off in the number of in movers.
There are some pretty dramatic movements in the early 90s, which were an interesting time in urban America to put it mildly. I’m not familiar with the specifics of Baltimore in that era. Some other regions I looked at – including St. Louis, which is also an independent city – show higher early 90’s migration, but nothing like the swing in Baltimore.
We will have to see what happens in post-2011 years. The IRS is delayed in issuing data, and has been trying to kill off this data program entirely, so who knows when more data will be available. 2012 data should in theory be out right about now, but we are some years away at best from finding out what impact this year’s riots might have had.
I should caveat this data by noting that it is based on tax returns that can be matched from year to year, so there are some movers who aren’t captured. As you can see, this is a pretty large data set, however.
Aaron M. Renn is a senior fellow at the Manhattan Institute and a Contributing Editor at City Journal. He writes at The Urbanophile, where this piece first appeared.


Penyakit Asam Urat
Thank you very much for all your exciting news to share suidah money.
Greetings healthy! Hope it is useful.
Obat Asam Urat Herbal
Brain drain
When people leave they not only take their money with them. They take their brains too. It is now estimated that the average IQ of those remaining behind is well down into the double digits, not only among blacks but among whites as well. The dumb and the clueless have a hard time in this American society today, especially now when our governing elites refuse to acknowledge their disabilities and devise economic policies (free trade with the Far East, mass immigration from Latin America) that adversely affect their employment opportunities out of all proportion to more favored groups.
Realism is the first desideratum for moral responsibility in this world. Our governing elites, the ones drawn from the Baby Boom generation, are the least competent in our history. Want proof? Look around you.