
By Susanne Trimbath and Juan Montoya
We just passed an era when the “American Dream” of home ownership was diminished as the growth of home prices outpaced income. From 2001 through 2006, home prices grew at an annual average of 6.85%, more than three times the growth rate for income.
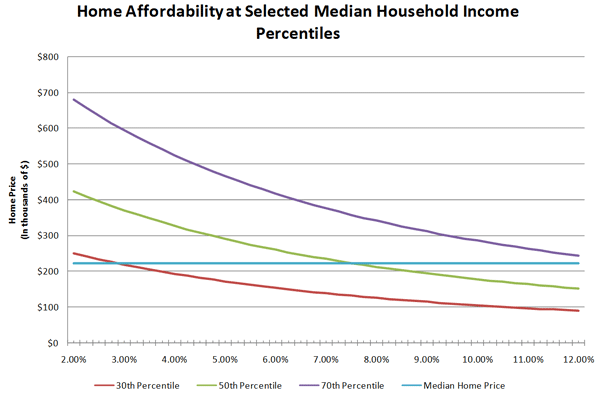
This divergence between income and housing costs has turned out to be a disaster, particularly for buyers at the lower end of the spectrum. In contrast, affluent buyers – those making over $120,000 – the bubble may still have been a boom, even if not quite as large as many had hoped for.
For middle and working class people, the pressure on affordability was offset by historically low mortgage interest rates which fell from over 11 percent around the time of the 1987 Stock Market Crash to 6 percent in 2002. Yet if stable interest rates were beneficial to overall affordability, the artificially low interest rates promoted by the Federal Reserve may have created instability. By allowing people to increase their purchasing power to an extraordinary level, low mortgage interest rates fueled a rapid escalation in housing prices.
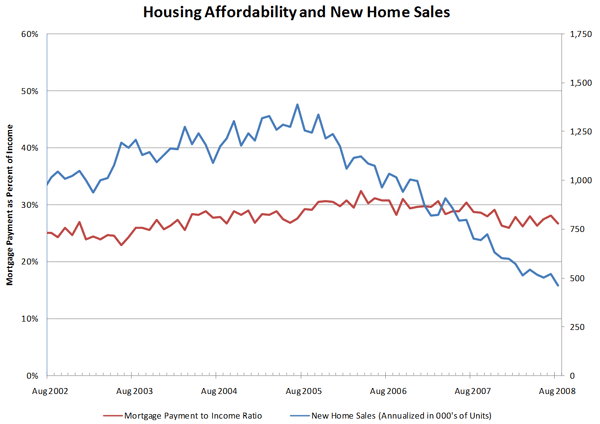
Now that prices are falling quicker than incomes, there should be a surge in new buyers. Since 1975, whenever the ratio of mortgage payments to income falls, home sales usually rise. The correlation coefficient indicates that for every 1% improvement in affordability there is a 2% increase in home sales. But now, something is wrong. In 2007, for every 1% improvement in affordability, home sales fell by 2%.
Part of the problem is that prices still are simply too high. Even as recently as August 2008, the median home price was still historically high in comparison to median income – about 4 times. It takes lower rates than in the past for a family with the median income to afford the median priced house. This means that homes are less affordable today than they were 6 years ago.
The last time that home sales fell as they became more affordable was in the 1990s at a time known as a “credit crunch.” At that time, the ratio of home prices to income was actually lower – 3.8 times in September 1990 compared to 4.3 in September 2008. The difference was that between 1990 and 1992 mortgage interest rates averaged a hefty 9.26%. In the last 3 years, the average was 6.14% and while the words “credit crisis” bled in headlines around the world, the regular mortgage interest rate barely budged.
What we are clearly witnessing is a fundamental slow-down in the gains towards homeownership. Of course, most of the gains in homeownership in the US were made in the 20 years after World War II: owner-occupied housing went from 43% in 1940 to 62% in 1960. In the 40 years that followed ownership crept up a bit, from 62% to 68%.
Boom, yes. But for Whom?
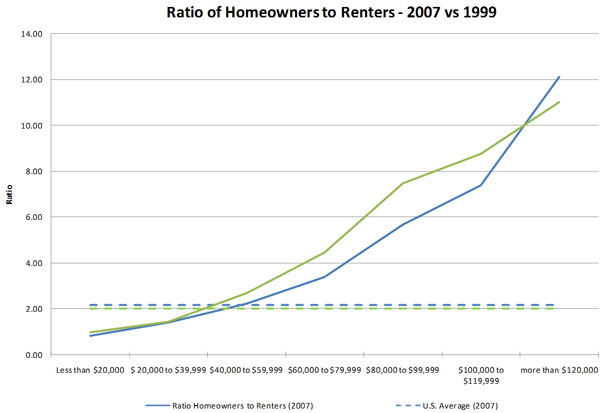
One disturbing aspect of this slow-down has been its effects by class. Overall, ownership has gained only among households making $120,000 or more; for all other groups the ratio of owners to renters is lower today than it was in 1999. (About 80% of American households have income less than $100,000 per year. For Hispanics and African Americans, the number is closer to 90%.)
There have been some exceptions, particularly among minorities targeted by national policy: expanding home ownership opportunities for minorities was a fundamental aim of President Bush’s housing policy. In the early years of this decade Hispanics enjoyed a net 2.6 percentage point gain in home ownership. In the next four years, while most Americans were seeing a decrease in home ownership, the Hispanic population continued to see gains. Although African Americans initially gained more than Whites in home ownership, they gave back more of those gains in the housing collapse
The great irony is that exactly those programs aimed at improving affordability may have been responsible for this recent decline. We first wrote about Housing Affordability in 2002. One of our concerns then proved to be true: buyers would focus on “can I afford this home” instead of “what is this home worth.” Although there were some gains in overall home ownership rates in the US during the early part of the boom, about 40 percent of that was given back during the last four years as home prices surged out of reach.
|
|
Rate |
Change in Rate |
||
|
Location |
2008 Q2 |
1999-2004 |
2004-2008 |
1999 - 2008 |
|
US |
68.1 |
2.2 |
-0.9 |
1.3 |
|
Northeast |
65.3 |
1.9 |
0.3 |
2.2 |
|
Midwest |
71.7 |
2.1 |
-2.1 |
0.0 |
|
South |
70.2 |
1.8 |
-0.7 |
1.1 |
|
West |
63.0 |
3.3 |
-1.2 |
2.1 |
|
City |
53.4 |
2.7 |
0.3 |
3.0 |
|
Suburb |
75.5 |
2.1 |
-0.2 |
1.9 |
|
Non-metro* |
74.9 |
0.9 |
-1.4 |
-0.5 |
|
White |
75.2 |
2.8 |
-0.8 |
2.0 |
|
Black |
48.4 |
3.0 |
-1.3 |
1.7 |
|
Other** |
60.2 |
5.5 |
0.6 |
6.1 |
|
Multi |
56.4 |
NA |
-4.0 |
NA |
|
Hispanic |
49.6 |
2.6 |
1.5 |
4.1 |
Table based on historical data from US Housing Market Conditions, U.S. Department of Housing and Urban Development, Office of Policy Development and Research,
*Non-metro includes all areas outside metropolitan statistical areas (non-urban). Note from Census.gov: For Census 2000, the Census Bureau classifies as "urban" all territory, population, and housing units located within an urbanized area (UA) or an urban cluster (UC). It delineates UA and UC boundaries to encompass densely settled territory, which consists of: core census block groups or blocks that have a population density of at least 1,000 people per square mile and surrounding census blocks that have an overall density of at least 500 people per square mile.
**”Other” includes “Asian”, which reports household incomes about 20% to 30% higher than the Racial/Ethnic category “All” regardless of income level category.
The areas with the biggest losses in home ownership rates in the 2004-2008 period were outside the cities, particularly in the Midwest which encompasses Missouri, Iowa, Kansas, Nebraska, Minnesota and the Dakotas (west north central) plus Wisconsin, Illinois, Indiana, Michigan and Ohio (east north central). Of the geographic segments, non-metropolitan Americans gained the least in home ownership in the 1999-2004 housing boom; and only the Midwest geographic segment gave back more.
What about the future? The Obama-Biden Agenda Plan on Urban Policy mentions housing nine times, including a headline on “Housing” with plans for making the mortgage interest tax deduction available to all homeowners (it currently requires itemization) and an increase in the supply of affordable housing throughout Metropolitan Regions. The former should help middle-class households; the latter will help lower-income households. This is not a continuation of the Bush Administration policy which relied on stimulating the demand for housing by providing mechanisms to bring households into the market. The data shows that low income households barely kept even on ownership (versus renting) under this policy, middle-class households suffered tremendous losses and only the wealthy, those making more than $120,000 in income, had a gain in home ownership.
The last President ignored our advice in 2002: “A more balanced effort to stimulate supply would equilibrate the potential adverse affect on prices” from over stimulating demand. Let’s hope this new President gets the balance right.
Dr. Trimbath is a former manager of depository trust and clearing corporations in San Francisco and New York. She is co-author of Beyond Junk Bonds: Expanding High Yield Markets (Oxford University Press, 2003), a review of the post-Drexel world of non-investment grade bond markets. Dr. Trimbath is also co-editor of and a contributor to The Savings and Loan Crisis: Lessons from a Regulatory Failure (Kluwer Academic Press, 2004)
Mr. Montoya obtained his MBA from Babson College (Wellesley, MA) and is a former research analyst at the Milken Institute (Santa Monica, CA) where he coauthored Housing Affordability in Three Dimensions with Dr. Trimbath. He currently works in the foodservice industry.


By Susanne Trimbath and Juan
By Susanne Trimbath and Juan Montoya
We just passed an era when the “American Dream” bleach anime of home ownership was diminished as the growth of home prices outpaced income. From 2001 through 2006, home prices grew at an annual average of 6.85%, more than three times the growth rate for income.
This divergence Noblesse manga read between income and housing costs has turned out to be a disaster, particularly for buyers at the lower end of the spectrum. In contrast, affluent buyers – those making over $120,000 – the bubble ma
Boom, but for whom
There are a lot of stats that can prove either side is benefiting from the so called Boom. I recall last year the economy was so bad that i had to think if i should change my air purifiers or hold off for the moment.
great
great article
http://www.housesflatsforsale.info/goldersgreenestate.html
Fries
Yeah, I'll bet lots of people who believed that housing was always going to go up (ears burning anyone) will be dishing out fries now! Maybe they should try a little humble pie with it too! Just kidding.
Great article
Cogent and full of data.
More articles similar to this one in style.
(This is funny: "He currently works in the foodservice industry." as in "Would you like fries with that?")
Maybe we need to start talking about the "natural rate" of home ownership similar to the natural rate of unemployment. Maybe there is some percentage of the population that will never be (should not be?) homeowners.
I am not an economist, but the historical evidence indicates to me that the stability point for housing prices and sales and ownership is when the "typical" house costs 2.5x to 3.0x household income. cf. Case-Schiller long-term index.
Dave Barnes
+1.303.744.9024
http://www.MarketingTactics.com
P.S. Living in the basement with my iMac and my Babson MBA.
Re: natural rate of homeownership
There does appear to be resistance at about 67-68% nationally. It is possible that some people who can afford to buy aren't interested; maintaining a home takes time or money to hire maintenance, it locks up significant capital for a long time, etc. Also possible that homes are over-priced when capital is readily available so that buyers wait for a better value; then when prices moderate borrowing becomes more difficult (think about government-induced credit cycles).
By the way, Mr. Montoya manages international operations for that foodservice firm. He's doing this research on his own time; it's reasonable for him to protect his employer's identity.