
Few terms are more misunderstood than "urban sprawl." Generally, it refers to the spatial expansion (dispersion) of cities and has been use to describe urbanization from the most dense (least sprawling) in the world (Dhaka, Bangladesh), the most dense in the United States (Los Angeles) and also the least dense in the world (such as Atlanta and Charlotte, low density world champions in their population categories).
The discussion of density and dispersion is often confused, a prisoner of pre-conceived notions about various urban areas. Boston is in a class by itself in this regard. Boston certainly deserves its reputation for a high density urban core and a strong CBD. Yet, Boston itself represents only a small part of the urbanization in its commute shed, which is a combined statistical area (CSA) or stand-alone metropolitan area (Note 2). The CSA is the largest labor market definition and combines adjacent metropolitan areas with strong commuting ties. The city of Boston had only 8% of the Boston-Worcester-Providence CSA population in 2010.
Much of the Boston CSA is made up of extensive, low density suburbanization more akin to Atlanta or Charlotte than to Los Angeles, which has the densest suburbs.
The Boston Combined Statistical Area
In contrast to its reputation for compactness, the Boston CSA is massive in its geography, covering more than 9,700 square miles (25,000 square kilometers). It is larger than Slovenia or Israel. The CSA stretches across parts of four states, including the eastern half of Massachusetts, all of Rhode Island, a large southeastern corner of New Hampshire and the northeastern corner of Connecticut. It includes the Boston, Providence, Worcester, Manchester and Barnstable Town metropolitan areas and the Concord (NH) and Laconia (NH) micropolitan areas.
Boston is the only CSA in the nation that includes three state capitals, Boston (Massachusetts), Providence (Rhode Island) and Concord (New Hampshire). It is the only CSA in the nation that contains the largest municipalities in three states, Boston, Providence and Manchester (New Hampshire).
The Boston CSA also includes multiple CBDs, from the fifth largest in the nation, Boston, to much smaller, but historically significant Providence, Worcester, and Manchester.
Consider this: The Boston CSA is more than 200 miles (320 kilometers) from the southernmost point, Westerly, Rhode Island to the northernmost point, on the shores of Lake Winnipesaukee, north of Laconia, New Hampshire and more than a third the way to Montréal. Westerly itself is less than 50 miles (80 kilometers) from the New York combined statistical area, which begins at Madison, Connecticut across the New Haven County line. From Boston's easternmost point near Provincetown, at the end of Cape Cod, it is more than 225 miles (360 kilometers) to Lake Winnipesaukee. From Provincetown to Athol, Massachusetts, to the west is more than 180 miles (290 kilometers).
Urbanization in the Boston CSA
But perhaps the most remarkable feature of this "Greater Greater Boston" is the extent of its urbanization (Note 3). The urban areas within the Boston CSA cover 3,640 square miles (9,400 square kilometers). This includes the dominant urban area of Boston (4.2 million), Providence (1.1 million), Worcester (0.5 million), which have largely grown together and a number of other urban areas. The urbanization is illustrated in the photograph above, which superimposes a Census Bureau maps of Boston's urbanization and the Boston CSA, both on a Google Earth image. The CSA is a "reddish" color, while the urban areas are more "pinkish," and completely enclosed in the CSA.
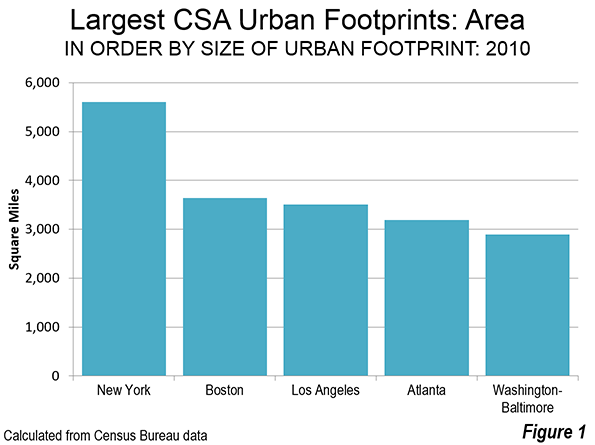
If all of Boston's urbanization were a single urban area, it would be the third most expansive in the world (Figure 1), following the combined urban area of New York-Bridgeport-New Haven (4,500 square miles or 11,600 square kilometers) and Tokyo-Yokohama (3,300 square miles or 8,500 square kilometers).
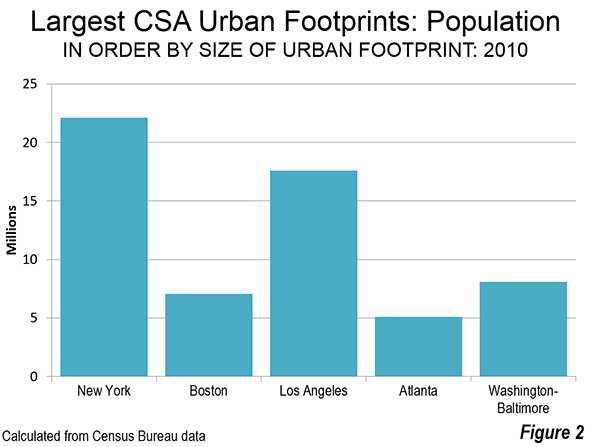
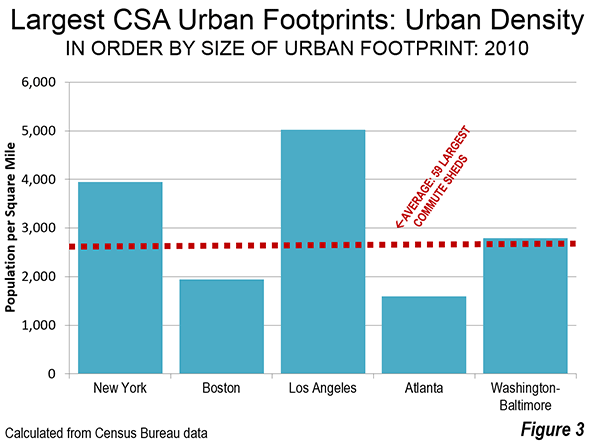
There is a big difference, however, in the intensity of development between the urbanization in these labor markets. The urban population of the Boston CSA is 7.1 million (Figure 2). The urbanization of the New York CSA has more than three times as many people (23 million), but covers only about 1.5 times the land area. Tokyo, with a tenth less land area, has more than five times the population (38 million). With a density of 1,941 per square mile (750 per square kilometer), the urbanization of Boston is 60% less dense (Figure 3) than the urbanization of the Los Angeles CSA (5,020 per square mile or 1,940 per square kilometer), which includes the Inland Empire urban area of Riverside-San Bernardino.
Pre-World War II Boston is largely confined within the Route 128 semi-circumferential highway (most of it now called Interstate 95), had a 2010 population of approximately 1.9 million, with a population density of 6,300 per square mile (2,400 per square kilometer). The core city of Boston is among the most dense in the United States, with a 2014 density of 13,300 per square mile (5,200 per square kilometer). It is also very successful, having experienced a strong population turnaround, after falling from 801,000 residents in 1950 to 562,000 in 1980 (a 30% loss). By 2014, the city had recovered nearly 40% of its former population, rising to 656,000.
Suburban Densities
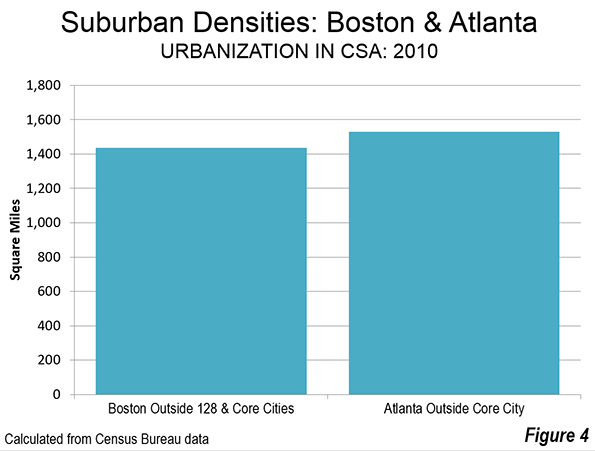
But once you get outside of 128, Boston's urban population density fall steeply. If the denser urbanization inside Route 128 and the historic, dense municipalities of Providence, Worcester and Manchester are excluded, the remainder of Boston's urbanization has a population density of 1,435 per square mile (550 per square kilometer). This is less dense than Atlanta's urbanization outside the city of Atlanta. Overall, the Atlanta urban area is the least dense in the world with more than 2.5 million population. Approximately two-thirds of the Boston CSA urban population lives in these sparsely settled suburbs (Figure 4).
If the Boston CSA were as dense as the Los Angeles urban form, the population would be 18.3 million, not 7.1 million, more than 2.5 times as -people as now reside there.
In many ways, Boston is the epitome of the dispersed urban development that followed World War II. Once one of the nation's densest urban areas, it has evolved into one of the least. What distinguishes Boston from other low density urban areas, like Atlanta, Charlotte or Birmingham (Alabama) is that is core well reflects the urban form built for the pre-automobile age.
Employment Dispersion
As would be expected, Boston's highly dispersed urbanization has been accompanied by highly dispersed employment. Despite having the fifth largest CBD in the nation, Boston's "hub" accounts for only 6% of the CSA employment. In the 1950s and 1960s, Route 128 became the nation's first high-tech corridor and has been referred to as the birthplace of the modern industrial park. But most people work outside 128.
Despite Boston's huge urban expanse the average trip travel time is only 29 minutes. This is slightly above the US average of 26 minutes and 18 minutes shorter than Hong Kong, the high-income world's densest urban area. Hong Kong's urban density is more than 30 times that of Boston's urbanization.
One of the World's Most Prosperous Metropolitan Areas
Highly dispersed Boston has emerged as one of the world's most affluent areas. According to the Brookings Global Metro Monitor, the Boston metropolitan area has the fourth largest GDP per capita, purchasing power parity, in the world. Boston trailed only Macau, nearby Hartford and San Jose, the world's leading technology hub. Two other Boston CSA metropolitan areas were successful enough to be included in the top 100 in the Brookings data. The Providence and Worcester metropolitan areas ranked in the top 100 (like 65 other US metropolitan areas), at about the same level as Vienna, while leading Brussels and Tokyo. Overall, Boston has to rank as one of the country’s – and the world’s most successful labor markets. It has done so while not being denser but while combining the virtues of both a successful core city and a large, expansive periphery.
Note 1: Cites have two generic forms, physical and economic (or functional). The physical form is the continuously built-up area, called the urban area or the urban agglomerations. This is the area that would be outlined by the lights of the city from a high flying airplane at night. The economic form is the labor market (metropolitan area or combined statistical area), which includes the urban area but stretches to include rural areas and other areas from which commuters are drawn. There is considerable confusion about urban terms, especially when applied to municipalities when called "cities," Municipalities are not themselves generic cities, but are usually parts of generic cities. Some municipalities may be larger than their corresponding generic cities (principally in China).
Note 2: "Commute sheds" encompass core based statistical areas, as defined by the Office of Management and Budget. including combined statistical areas, as well as metropolitan and micropolitan areas that are not a part of combined statistical areas), Combined statistical areas themselves are formed by strong commuting patterns between adjacent metropolitan and micropolitan areas. A table of all 569 commuter sheds is posted to demographia.com.
Note 3: Combined statistical areas (and metropolitan areas) often have more than one urban area. This article combines all of the urban areas in the Boston CSA, rather than focusing only on the principal urban area, Boston. Comparisons are made to the total urbanization (not the principal urban areas) of other CSAs in the United States.
Wendell Cox is Chair, Housing Affordability and Municipal Policy for the Frontier Centre for Public Policy (Canada), is a Senior Fellow of the Center for Opportunity Urbanism (US), a member of the Board of Advisors of the Center for Demographics and Policy at Chapman University (California) and principal of Demographia, an international public policy and demographics firm.
He is co-author of the "Demographia International Housing Affordability Survey" and author of "Demographia World Urban Areas" and "War on the Dream: How Anti-Sprawl Policy Threatens the Quality of Life." He was appointed to three terms on the Los Angeles County Transportation Commission, where he served with the leading city and county leadership as the only non-elected member. He served as a visiting professor at theConservatoire National des Arts et Metiers,a national university in Paris.
Photo: Second largest geographical expanse of labor market urbanization in the world (Boston). US Census Bureau maps superimposed on Google Earth.


