
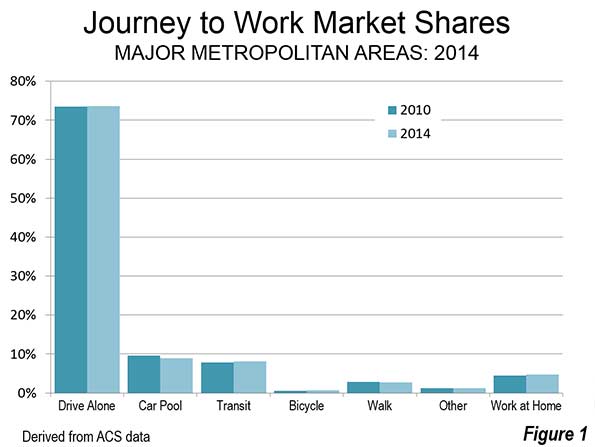
The major metropolitan area journey to work data is out, reported in the American Community Survey ‘s 2014 one year edition. The news is that there is not much news. Little has changed since 2010 despite all the talk about “peak car” and a supposed massive shift towards transit. Single occupant driving remains by far the largest mode of transport to work in the 53 major metropolitan areas (with over 1,000,000 population), having moved from 73.5 percent of commutes to 73.6 percent. Little upward change in single occupant commuting can be expected, since it is probably already a virtual saturation rate.
The only significant change is the most important trend that is occurred for decades in US commuting: the reduction in carpooling. Between 2010 and 2014, carpooling dropped from 9.8 percent to 8.8 percent in the major metropolitan areas.
Transit continued to hold on to third place, with an increase from 7.9 percent to 8.1 percent in the major metropolitan areas. Working at home, including telecommuting, continued its more dramatic rise, from 4.4 percent in 2010 to 4.7 percent in 2014. Walking remained constant at 2.8 percent, while cycling continued its increase but from a small 0.5 percent to 0.7 percent. Other modes of transport, such as taxis and motorcycles remained constant at 1.2 percent (Figure 1).
In the major metropolitan areas, transit continued to lead over working at home (8.1 percent compared to 4.7 percent), though at the national level the margin was much smaller (5.2 percent compared to 4.5 percent). Transit strength was far more concentrated principally in a few metropolitan areas with “legacy” cities and, as a result, working at home exceeded transit's market share in 39 of the 53 markets.
Should carpooling continue its downward trend, it would fall below transit before the end of the decade among the major metropolitan areas (now at 8.8 percent compared to transit 8.1 percent), though the carpooling lead is sufficient to retain second-place far longer at the national level (9.2 percent compared to 5.2 percent). As in working at home, however, transit's strength is highly concentrated relative to carpooling. Transit leads carpooling only in the six metropolitan areas with transit legacy cities (New York, Chicago, Philadelphia, San Francisco, Boston, and Washington), while carpooling leads in 47 metropolitan areas.
Commuting market share data for the major metropolitan areas is shown in Tables 1 and 2.
Transit Gains and Losses
With by far the most attractive urban environment for transit use in the United States and far and away the largest system, New York dominated the transit share of the journey to work data, adding 240,000 daily transit commuters between 2010 and 2014 (out of a national total of 576,000). Six other metropolitan areas with the strongest transit gains were San Francisco at 66,000, Chicago with 41,000, Boston with 38,000, Seattle with 34,000 and Washington with 32,000. All of these were above the next highest, Philadelphia, with 16,000. Each of these metropolitan areas, with the exception of Seattle, has a transit legacy city at its core. Overall the other 45 metropolitan areas, with nearly 70 percent of the population, accounted for less than 20 percent of the transit increase.
Los Angeles, which has been hailed as the becoming "next transit city," seems long on intentions and construction, but wanting in results. The laggard transit performance of Los Angeles, despite one of the world's most aggressive rail construction programs has been described in a recent Orange County Register commentary. In 2014-2015, ridership on the legacy MTA (former SCRTD) bus and rail system was almost 10 percent below the bus only system of 1985, despite an increase in the Los Angeles County population of approximately one-quarter (see: Los Angeles; Rail for Others).
Thirteen metropolitan areas experienced modest transit commuting losses (less than 3,000). In addition to Los Angeles, these included rail metropolitan areas Virginia Beach-Norfolk, San Diego, Buffalo, Cleveland, and Pittsburgh.
Working at Home Gains and Losses
The largest working at home gain was also in New York, at 40,000 (out of 499,000 in the major metropolitan areas). The second largest gain was in Los Angeles at 32,000. San Diego added 27,000 people accessing work from home. Four metropolitan areas lost commuters who work at home, though the losses were modest (less than 1,000) in all but Virginia Beach-Norfolk, where the decline was more than 11,000.
Driving Alone Gains, No Losses
New York also led in the number of additional commuters driving alone to work, adding more than 420,000. The other largest gainers were in Los Angeles at 325,000 and Houston at 309,000. All of the 53 major metropolitan areas added single occupant commuters and in each single occupant commuting added more than any other mode, including transit. Rochester had the smallest increase, at 7,000.
Carpool Gains and Losses
Despite its continuing overall losses, carpooling made gains in some metropolitan areas. Detroit led with nearly 14,000 new carpoolers, followed closely by Orlando, Portland, and Dallas-Fort Worth both added more than 10,000 new carpoolers, adding more commuters than their rail oriented transit systems.
However, the car pool losses were generally more severe. Chicago lost nearly 36,000 carpooling commuters. Los Angeles lost 30,000, New York lost 29,000 and Tampa-St. Petersburg lost 19,000. Losses of more than 10,000 were also sustained in Washington, St. Louis, San Diego, Pittsburgh, Phoenix, Memphis, Baltimore, and Boston.
Cycling Gains and Losses
New York also gained the most cycling commuters, at nearly 14,000, followed by San Francisco at 13,000, Los Angeles at 10,000. Eight metropolitan areas lost cycling commuters, but only two exceeded 250, Grand Rapids (800 loss) and Riverside-San Bernardino (700 loss).
More of the Same
U.S. commuters continue to travel to work using the modes that have dominated for decades, with the exceptions of substantial increases in working at home and big losses in car pooling. Though even in these modes, the changes are slight in view of the dominance of single-occupant commuting, as Figure 1 indicates. This is not surprising, commuters who drive alone reach virtually anywhere in the metropolitan area and nearly always at a faster speed than any other method of commuting, save working at home.
| Table 1 | |||||||
| Transit Work Trip Market Share: 2014 | |||||||
| Major Metropolitan Areas (53 over 1,000,000 Population) | |||||||
| MARKET SHARE | |||||||
| MSA | Drive Alone | Car Pool | Transit | Bicycle | Walk | Other | Work at Home |
| Atlanta, GA | 77.6% | 10.3% | 3.1% | 0.2% | 1.4% | 1.4% | 6.2% |
| Austin, TX | 76.6% | 10.1% | 2.5% | 0.7% | 1.7% | 1.5% | 6.9% |
| Baltimore, MD | 77.2% | 8.2% | 6.6% | 0.3% | 2.6% | 1.1% | 4.0% |
| Birmingham, AL | 85.2% | 9.1% | 0.5% | 0.2% | 1.1% | 1.1% | 2.9% |
| Boston, MA-NH | 67.6% | 6.8% | 12.9% | 1.0% | 5.3% | 1.2% | 5.1% |
| Buffalo, NY | 82.3% | 7.7% | 3.0% | 0.4% | 2.9% | 0.9% | 2.9% |
| Charlotte, NC-SC | 81.0% | 9.4% | 1.9% | 0.2% | 1.4% | 1.1% | 5.1% |
| Chicago, IL-IN-WI | 70.9% | 7.7% | 11.9% | 0.7% | 3.2% | 1.2% | 4.5% |
| Cincinnati, OH-KY-IN | 82.8% | 7.9% | 2.1% | 0.3% | 2.0% | 0.8% | 4.1% |
| Cleveland, OH | 82.3% | 6.8% | 3.2% | 0.3% | 2.6% | 0.9% | 3.9% |
| Columbus, OH | 83.0% | 7.7% | 1.8% | 0.5% | 2.1% | 0.7% | 4.4% |
| Dallas-Fort Worth, TX | 80.8% | 9.9% | 1.6% | 0.2% | 1.2% | 1.7% | 4.6% |
| Denver, CO | 76.3% | 8.8% | 4.5% | 0.9% | 2.0% | 0.8% | 6.6% |
| Detroit, MI | 84.0% | 9.0% | 1.6% | 0.3% | 1.3% | 0.8% | 3.1% |
| Grand Rapids, MI | 81.6% | 8.9% | 1.7% | 0.3% | 2.2% | 1.4% | 4.0% |
| Hartford, CT | 81.4% | 7.8% | 2.7% | 0.2% | 2.6% | 1.1% | 4.2% |
| Houston, TX | 80.3% | 10.7% | 2.4% | 0.3% | 1.3% | 1.6% | 3.4% |
| Indianapolis. IN | 84.2% | 8.5% | 1.2% | 0.3% | 1.3% | 0.7% | 3.8% |
| Jacksonville, FL | 80.4% | 9.7% | 1.2% | 0.6% | 1.2% | 1.7% | 5.2% |
| Kansas City, MO-KS | 83.4% | 8.5% | 1.0% | 0.2% | 1.2% | 1.0% | 4.7% |
| Las Vegas, NV | 77.6% | 10.2% | 4.8% | 0.5% | 1.6% | 2.3% | 3.1% |
| Los Angeles, CA | 74.6% | 9.7% | 5.8% | 1.0% | 2.5% | 1.3% | 5.1% |
| Louisville, KY-IN | 81.8% | 9.5% | 2.0% | 0.3% | 1.7% | 1.0% | 3.7% |
| Memphis, TN-MS-AR | 84.9% | 8.6% | 1.0% | 0.1% | 1.1% | 1.7% | 2.6% |
| Miami, FL | 78.7% | 8.9% | 3.7% | 0.6% | 1.7% | 1.4% | 5.0% |
| Milwaukee,WI | 80.6% | 8.4% | 3.5% | 0.5% | 2.6% | 0.8% | 3.6% |
| Minneapolis-St. Paul, MN-WI | 77.3% | 8.6% | 4.8% | 1.0% | 2.4% | 0.9% | 4.9% |
| Nashville, TN | 81.7% | 9.8% | 1.3% | 0.2% | 1.6% | 0.8% | 4.6% |
| New Orleans. LA | 79.2% | 9.7% | 3.1% | 1.3% | 2.3% | 1.5% | 2.9% |
| New York, NY-NJ-PA | 50.2% | 6.4% | 31.1% | 0.6% | 6.0% | 1.5% | 4.2% |
| Oklahoma City, OK | 82.8% | 10.1% | 0.4% | 0.4% | 1.5% | 1.1% | 3.7% |
| Orlando, FL | 79.8% | 9.9% | 2.0% | 0.6% | 0.9% | 1.2% | 5.6% |
| Philadelphia, PA-NJ-DE-MD | 73.0% | 7.8% | 9.7% | 0.6% | 3.7% | 0.8% | 4.3% |
| Phoenix, AZ | 77.0% | 10.5% | 2.1% | 0.9% | 1.5% | 1.9% | 6.1% |
| Pittsburgh, PA | 77.5% | 8.1% | 5.6% | 0.4% | 3.4% | 0.8% | 4.1% |
| Portland, OR-WA | 70.0% | 10.2% | 6.5% | 2.6% | 3.3% | 1.0% | 6.4% |
| Providence, RI-MA | 81.1% | 7.9% | 2.8% | 0.5% | 3.4% | 0.9% | 3.5% |
| Raleigh, NC | 80.0% | 9.0% | 1.0% | 0.2% | 1.3% | 1.1% | 7.3% |
| Richmond, VA | 81.8% | 9.1% | 1.7% | 0.4% | 1.6% | 1.2% | 4.2% |
| Riverside-San Bernardino, CA | 77.4% | 13.3% | 1.6% | 0.3% | 1.7% | 1.0% | 4.7% |
| Rochester, NY | 82.5% | 6.9% | 2.5% | 0.7% | 3.1% | 0.7% | 3.7% |
| Sacramento, CA | 76.4% | 10.2% | 2.7% | 1.8% | 2.0% | 1.3% | 5.5% |
| Salt Lake City, UT | 74.9% | 12.2% | 3.8% | 0.8% | 2.1% | 0.8% | 5.3% |
| San Antonio, TX | 80.0% | 10.8% | 2.1% | 0.2% | 1.7% | 0.9% | 4.3% |
| San Diego, CA | 76.0% | 8.6% | 2.7% | 0.8% | 2.9% | 1.4% | 7.5% |
| San Francisco-Oakland, CA | 59.2% | 9.4% | 16.7% | 2.2% | 4.7% | 1.6% | 6.2% |
| San Jose, CA | 76.2% | 10.4% | 4.0% | 1.6% | 1.7% | 1.2% | 4.8% |
| Seattle, WA | 69.0% | 9.8% | 9.6% | 1.2% | 3.6% | 1.1% | 5.7% |
| St. Louis,, MO-IL | 82.7% | 7.3% | 2.9% | 0.3% | 1.8% | 0.8% | 4.1% |
| Tampa-St. Petersburg, FL | 81.1% | 7.4% | 1.5% | 0.9% | 1.5% | 1.7% | 5.9% |
| Virginia Beach-Norfolk, VA-NC | 82.4% | 8.2% | 1.6% | 0.5% | 3.0% | 1.2% | 3.1% |
| Tucson, AZ | 77.0% | 9.1% | 2.9% | 2.1% | 2.5% | 2.0% | 4.5% |
| Washington, DC-VA-MD-WV | 66.1% | 9.7% | 14.3% | 0.8% | 3.1% | 1.0% | 5.1% |
| Major Metropolitan Areas | 73.6% | 8.8% | 8.1% | 0.7% | 2.8% | 1.2% | 4.7% |
| Outside Major Metropolitan Areas | 80.4% | 9.8% | 1.2% | 0.5% | 2.7% | 1.2% | 4.1% |
| United States | 76.5% | 9.2% | 5.2% | 0.6% | 2.7% | 1.2% | 4.5% |
| From American Community Survey: 2014 (1 Year) | |||||||
| Table 2 | |||||||
| Transit Work Trip Market Share: 2010 (2008-2012 ACS) | |||||||
| Major Metropolitan Areas (53 over 1,000,000 Population) | |||||||
| MARKET SHARE | |||||||
| MSA | Drive Alone | Car Pool | Transit | Bicycle | Walk | Other | Work at Home |
| Atlanta, GA | 77.6% | 10.7% | 3.2% | 0.2% | 1.3% | 1.4% | 5.6% |
| Austin, TX | 75.0% | 11.3% | 2.6% | 0.8% | 1.8% | 1.9% | 6.6% |
| Baltimore, MD | 76.3% | 9.7% | 6.3% | 0.3% | 2.7% | 0.9% | 3.9% |
| Birmingham, AL | 84.0% | 10.6% | 0.7% | 0.1% | 1.1% | 0.6% | 3.0% |
| Boston, MA-NH | 68.8% | 7.9% | 11.9% | 0.9% | 5.3% | 0.9% | 4.4% |
| Buffalo, NY | 81.8% | 8.1% | 3.5% | 0.4% | 3.0% | 0.9% | 2.4% |
| Charlotte, NC-SC | 80.5% | 10.4% | 1.8% | 0.1% | 1.4% | 0.9% | 4.9% |
| Chicago, IL-IN-WI | 70.9% | 8.8% | 11.3% | 0.6% | 3.1% | 1.1% | 4.2% |
| Cincinnati, OH-KY-IN | 82.6% | 8.7% | 2.2% | 0.2% | 2.1% | 0.7% | 3.6% |
| Cleveland, OH | 82.1% | 7.8% | 3.5% | 0.3% | 2.1% | 0.8% | 3.4% |
| Columbus, OH | 82.6% | 8.2% | 1.6% | 0.4% | 2.1% | 0.8% | 4.2% |
| Dallas-Fort Worth, TX | 80.9% | 10.5% | 1.5% | 0.2% | 1.2% | 1.3% | 4.5% |
| Denver, CO | 75.7% | 9.5% | 4.5% | 0.9% | 2.1% | 1.2% | 6.0% |
| Detroit, MI | 84.2% | 8.7% | 1.6% | 0.2% | 1.4% | 0.8% | 3.1% |
| Grand Rapids, MI | 82.8% | 8.9% | 1.2% | 0.5% | 1.9% | 0.7% | 3.9% |
| Hartford, CT | 81.0% | 8.2% | 3.1% | 0.2% | 2.7% | 1.0% | 3.8% |
| Houston, TX | 79.2% | 11.7% | 2.4% | 0.3% | 1.4% | 1.6% | 3.4% |
| Indianapolis. IN | 83.6% | 9.0% | 1.1% | 0.3% | 1.7% | 0.8% | 3.6% |
| Jacksonville, FL | 81.1% | 9.9% | 1.3% | 0.6% | 1.4% | 1.3% | 4.4% |
| Kansas City, MO-KS | 82.9% | 9.2% | 1.2% | 0.2% | 1.3% | 1.0% | 4.1% |
| Las Vegas, NV | 78.5% | 11.1% | 3.7% | 0.4% | 1.8% | 1.5% | 3.0% |
| Los Angeles, CA | 73.6% | 10.8% | 6.1% | 0.9% | 2.7% | 1.2% | 4.9% |
| Louisville, KY-IN | 82.9% | 9.3% | 2.1% | 0.3% | 1.7% | 0.8% | 2.9% |
| Memphis, TN-MS-AR | 82.8% | 10.7% | 1.3% | 0.1% | 1.3% | 1.0% | 2.8% |
| Miami, FL | 78.2% | 9.8% | 3.7% | 0.6% | 1.8% | 1.4% | 4.5% |
| Milwaukee,WI | 79.9% | 9.2% | 3.6% | 0.5% | 2.8% | 0.7% | 3.2% |
| Minneapolis-St. Paul, MN-WI | 78.1% | 8.6% | 4.6% | 0.9% | 2.3% | 0.8% | 4.7% |
| Nashville, TN | 81.5% | 10.4% | 1.1% | 0.2% | 1.2% | 0.9% | 4.6% |
| New Orleans. LA | 79.0% | 10.9% | 2.6% | 0.8% | 2.4% | 1.6% | 2.6% |
| New York, NY-NJ-PA | 51.0% | 7.1% | 29.9% | 0.5% | 6.1% | 1.6% | 3.9% |
| Oklahoma City, OK | 82.9% | 10.4% | 0.5% | 0.3% | 1.6% | 1.1% | 3.3% |
| Orlando, FL | 81.1% | 9.3% | 1.9% | 0.5% | 1.1% | 1.7% | 4.5% |
| Philadelphia, PA-NJ-DE-MD | 73.4% | 8.2% | 9.4% | 0.6% | 3.7% | 0.8% | 3.8% |
| Phoenix, AZ | 76.4% | 11.9% | 2.1% | 0.8% | 1.6% | 1.6% | 5.6% |
| Pittsburgh, PA | 76.9% | 9.3% | 5.7% | 0.2% | 3.6% | 0.9% | 3.5% |
| Portland, OR-WA | 71.2% | 9.7% | 6.1% | 2.2% | 3.5% | 1.0% | 6.3% |
| Providence, RI-MA | 80.8% | 8.8% | 2.7% | 0.3% | 3.2% | 0.9% | 3.3% |
| Raleigh, NC | 80.6% | 9.6% | 1.0% | 0.3% | 1.4% | 1.2% | 5.9% |
| Richmond, VA | 81.3% | 9.6% | 2.0% | 0.4% | 1.4% | 0.8% | 4.5% |
| Riverside-San Bernardino, CA | 76.2% | 14.4% | 1.6% | 0.4% | 1.8% | 1.1% | 4.4% |
| Rochester, NY | 81.4% | 8.4% | 1.9% | 0.5% | 3.6% | 0.7% | 3.5% |
| Sacramento, CA | 75.1% | 11.6% | 2.7% | 1.8% | 2.0% | 1.2% | 5.6% |
| Salt Lake City, UT | 75.9% | 12.0% | 3.5% | 0.8% | 2.3% | 1.2% | 4.3% |
| San Antonio, TX | 79.1% | 11.5% | 2.2% | 0.1% | 1.9% | 1.2% | 3.9% |
| San Diego, CA | 75.9% | 10.2% | 3.1% | 0.7% | 2.7% | 1.1% | 6.3% |
| San Francisco-Oakland, CA | 61.5% | 10.3% | 14.7% | 1.7% | 4.3% | 1.4% | 6.0% |
| San Jose, CA | 76.5% | 10.4% | 3.2% | 1.7% | 2.1% | 1.4% | 4.7% |
| Seattle, WA | 69.7% | 11.0% | 8.3% | 1.0% | 3.6% | 1.1% | 5.3% |
| St. Louis,, MO-IL | 82.6% | 8.4% | 2.5% | 0.3% | 1.7% | 0.8% | 3.7% |
| Tampa-St. Petersburg, FL | 80.3% | 9.5% | 1.4% | 0.7% | 1.6% | 1.4% | 5.2% |
| Virginia Beach-Norfolk, VA-NC | 80.6% | 9.0% | 1.8% | 0.4% | 2.6% | 1.1% | 4.4% |
| Tucson, AZ | 76.5% | 10.3% | 2.4% | 1.5% | 2.5% | 2.0% | 4.8% |
| Washington, DC-VA-MD-WV | 66.0% | 10.6% | 14.0% | 0.6% | 3.2% | 0.9% | 4.7% |
| Major Metropolitan Areas | 73.5% | 9.6% | 7.9% | 0.6% | 2.8% | 1.2% | 4.4% |
| Outside Major Metropolitan Areas | 80.8% | 9.8% | 0.9% | 0.5% | 2.7% | 1.2% | 4.2% |
| United States | 76.6% | 9.7% | 4.9% | 0.5% | 2.8% | 1.2% | 4.3% |
| From American Community Survey:2008-2012 | |||||||
Wendell Cox is Chair, Housing Affordability and Municipal Policy for the Frontier Centre for Public Policy (Canada), is a Senior Fellow of the Center for Opportunity Urbanism (US), a member of the Board of Advisors of the Center for Demographics and Policy at Chapman University (California) and principal of Demographia, an international public policy and demographics firm.He is co-author of the "Demographia International Housing Affordability Survey" and author of "Demographia World Urban Areas" and "War on the Dream: How Anti-Sprawl Policy Threatens the Quality of Life." He was appointed to three terms on the Los Angeles County Transportation Commission, where he served with the leading city and county leadership as the only non-elected member. He served as a visiting professor at the Conservatoire National des Arts et Metiers, a national university in Paris.
Photo: Harbor Freeway (I-110), Los Angeles (by author)


