
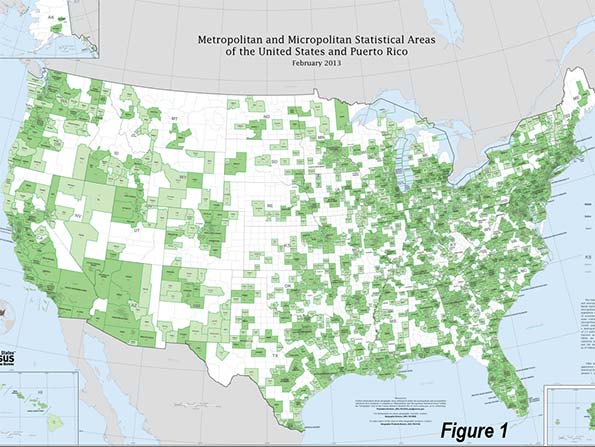
To the untrained eye, looking at a map of metropolitan America can lead one to the conclusion that at least half the nation’s land area is covered by urbanization. This is illustrated by Figure 1 below, which is a Census Bureau map of metropolitan areas as defined in 2013. These areas cover approximately 1.675 million square miles, which represents 47 percent of the US land area.
Metropolitan Land: More Rural than Urban
However, someone well informed in urban geography would quickly retort that most metropolitan areas are more rural than are urban and, in total, the only 3% of the nation’s land area is in urban development. This shown by data in the 2010 census, which counts as urban all settlements with at least 2,500 population (a complete list of the 3,600 urban areas is at http://demographia.com/db-uza2010.pdf).
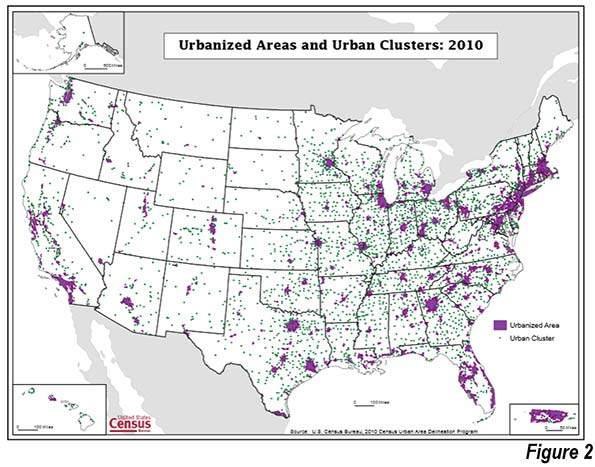
The difference is between two very different definitions of the city. The physical city, called the urban area in the United States, the built-up urban area in the United Kingdom, the unité urbaine in France and population center in Canada is the area of continuous urbanization (or development). The metropolitan area is a much larger geography that includes areas from which a substantial portion of the working population is employed in a core area that is, in the United States it is central counties, an area typically far larger than what was formerly called the “central city” or the “core city.” Figure 2 is a map of urban areas, which indicates the best approximation of the extent of urbanization in the United States.
Within metropolitan areas, the area between the principal urban area and metropolitan area boundaries is largely rural, but may also include urban areas. For example, in Los Angeles, Santa Clarita, Palmdale and Lancaster are secondary urban areas located between the principal urban area and the metropolitan boundary.
In the Riverside-San Bernardino metropolitan area, the Needles urban area also lies between the principal urban area and the metropolitan area boundary. However, Needles is more than 200 miles away from the city halls of either Riverside or San Bernardino and it would take a commuter at least three hours to reach either place, assuming no traffic congestion. In the United States, metropolitan areas are composed of entire counties and where there are larger counties, as in Riverside-San Bernardino, the metropolitan area contains much more area than represents a reasonable commuting distance. This also makes any urban research based on metropolitan area densities nonsensical, because they are driven by rural rather than urban densities.
Urban research needs to be performed using urban densities. That can be at the metropolitan area level or even the state level.
Highest Urban Density in California
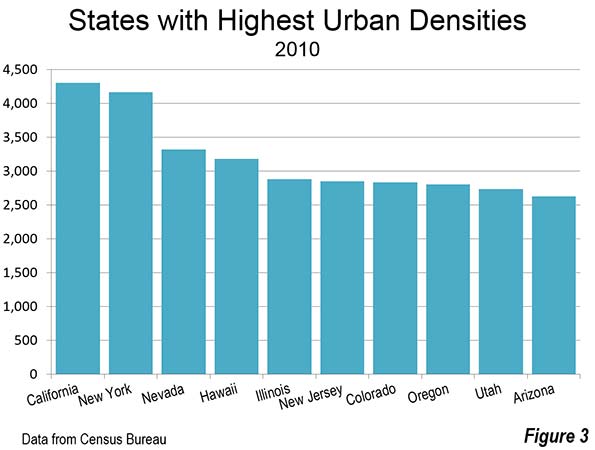
It may be surprising that California, which largely defined the suburbanized urban form that developed after World War II has the highest urban population density in the nation (Figure 3). California’s urban areas have an average density of 4300 per square mile. California has the three most densely populated large urban areas in the country: Los Angeles at approximately 7000 residents per square mile, San Francisco at approximately 6300 residents per square mile and San Jose with approximately 5800 residents per square mile. Indeed, San Jose, which does not even have a pre-World War II urban core (because it had too small a population at the time) is approximately 10% denser than the urban area with the nation’s largest pre-World War II urban core, New York (5300 residents per square mile).
Even before the radical densification policies of Senate Bill 375 were implemented, California’s high density credentials were impeccable. Among all urban areas in the nation, 21 of the densest 25 are in California, including Richgrove, an urban area of less than 3000 residents in a population density of over 10,000 per square mile. Richgrove is located in Tulare County, in the San Joaquin Valley, 10 miles east of State Highway 99, in the Delano area. Not only is Los Angeles nearly twice as dense as international densification model Portland, but San Francisco, San Jose, Sacramento, Riverside – San Bernardino and San Diego are also more dense than Portland, not to mention Fresno, Oxnard, Stockton, Los Banos, Simi Valley and Modesto and, of course Richgrove (as well as others).
New York has the second highest state urban population density at 4200 residents per square mile. Again, perhaps surprisingly, Nevada has the third highest population urban density, though well below New York at 3300 residents per square mile. Las Vegas is the fifth highest density urban area over 1,000,00 residents, at 4500 residents per square mile Only one other state, Hawaii, has an urban population density above 3000 residents per square mile (3200). Honolulu, with fewer than 1,000,000 residents, has an urban density of 4800 per square mile.
Rather than being dominated by the states with the urban areas perceived to be the densest, in the East and Midwest, seven are in the West, which has, like California, a reputation for urban sprawl. Only New Jersey, much of which is suburban New York or Philadelphia, as well as Illinois, home of the nation’s third largest urban area, Chicago, rank in the 10 densest states for urbanization.
Lowest Urban Densities in New Hampshire and the South
Eight of the 10 least dense states are in the South. Two are in the East, one of which should be no surprise, Maine, where all of the urban areas are somewhat small. (Figure 4) New Hampshire, however, may be surprising, since so much of the population is located in suburban Boston. One of the least accurate urban myths is about Boston as a dense urban area. Yes, it is dense inside Route 128 (Interstate 95), but beyond that it exhibits densities about the same as Atlanta, which is the least dense urban area in the world that has more than 2 million residents.

There were also some surprises outside the top and bottom 10. Nebraska ranked 11th in urban density, well above its Great Plains peers. Texas ranked 13th, at 2400 per square mile, nearly equaling number 12 Maryland. Connecticut, which is in the New York commuting zone ranked 38th.
Highest Urban Land Percentages in the Northeast Corridor
While California has the densest urbanization, it is by no means the most urbanized in terms of its amount of urban land area. Only 5 percent of California’s land area is urban, somewhat more than the national average, but 22 states have larger urbanization percentages. Four states are bunched up near the top, with between 37 percent and nearly 40 percent of their land area under urban development, New Jersey, Rhode Island, Massachusetts and Connecticut (Table). Each of these states is in the Northeast Corridor, home to nearly 50 million residents, that stretches from the suburbs south of Washington, through parts of 10 states and the District of Columbia, to the Boston suburbs of New Hampshire.
However, most states are far less urbanized. The fifth and sixth most urbanized states, Delaware and Maryland, are also in the northeast megalopolis, barely have as much urban land as the top four, at approximately 20 percent urbanized. It is another big drop to number seven Florida, at 14 percent.
Most States Have Little Urbanization
As would be expected, Alaska has the least urbanization, covering less than 0.1 percent of its land area. Wyoming is the second least urbanized, at 0.2 percent, closely followed by Montana (also 0.2 percent), North Dakota and South Dakota (both at 0.3 percent). The tenth least urbanized state, Utah, has only 1.1 percent of its land occupied by urbanization.
All of this indicates that the urbanization that houses more than 250 million residents in the United States covers only a much more modest share of its land than often thought (3.0 percent ). This is even truer outside the Northeast Corridor.
| Built-Up Urban Areas in the United States | |||||||||
| State & DC Totals: 2010 | |||||||||
| State/District | Urban Population | Urban Land Area (Square Miles) | Urban Density (Square Miles) | Urban Density (Square KM) | Urban Density Rank | Urban Popu- lation % |
Urban Popu- lation % Rank |
Urban Land/ Total Land | Urban Land % Rank |
| Alabama | 2,821,804 | 2,207 | 1,278 | 494 | 49 | 59.0% | 42 | 4.3% | 23 |
| Alaska | 468,893 | 260 | 1,803 | 696 | 36 | 66.0% | 37 | 0.0% | 50 |
| Arizona | 5,740,659 | 2,187 | 2,625 | 1,014 | 10 | 89.8% | 9 | 1.9% | 33 |
| Arkansas | 1,637,589 | 1,097 | 1,493 | 576 | 42 | 56.2% | 45 | 2.1% | 32 |
| California | 35,373,606 | 8,219 | 4,304 | 1,662 | 1 | 95.0% | 1 | 5.3% | 21 |
| Colorado | 4,332,761 | 1,528 | 2,836 | 1,095 | 7 | 86.2% | 14 | 1.5% | 37 |
| Connecticut | 3,144,942 | 1,826 | 1,722 | 665 | 38 | 88.0% | 11 | 37.7% | 4 |
| Delaware | 747,949 | 407 | 1,838 | 710 | 35 | 83.3% | 17 | 20.8% | 5 |
| District of Columbia | 601,723 | 61 | 9,857 | 3,806 | 100.0% | 100.0% | |||
| Florida | 17,139,844 | 7,403 | 2,315 | 894 | 16 | 91.2% | 6 | 13.7% | 7 |
| Georgia | 7,272,151 | 4,797 | 1,516 | 585 | 41 | 75.1% | 23 | 8.3% | 12 |
| Hawaii | 1,250,489 | 393 | 3,181 | 1,228 | 4 | 91.9% | 5 | 6.1% | 20 |
| Idaho | 1,106,370 | 499 | 2,217 | 856 | 19 | 70.6% | 30 | 0.6% | 45 |
| Illinois | 11,353,553 | 3,946 | 2,878 | 1,111 | 5 | 88.5% | 10 | 7.1% | 15 |
| Indiana | 4,697,100 | 2,525 | 1,860 | 718 | 34 | 72.4% | 29 | 7.0% | 17 |
| Iowa | 1,950,256 | 953 | 2,046 | 790 | 25 | 64.0% | 39 | 1.7% | 35 |
| Kansas | 2,116,961 | 973 | 2,176 | 840 | 21 | 74.2% | 25 | 1.2% | 38 |
| Kentucky | 2,533,343 | 1,411 | 1,796 | 693 | 37 | 58.4% | 43 | 3.6% | 25 |
| Louisiana | 3,317,805 | 1,968 | 1,686 | 651 | 39 | 73.2% | 27 | 4.5% | 22 |
| Maine | 513,542 | 360 | 1,428 | 551 | 44 | 38.7% | 50 | 1.2% | 39 |
| Maryland | 5,034,331 | 2,005 | 2,511 | 970 | 12 | 87.2% | 13 | 20.5% | 6 |
| Massachusetts | 6,021,989 | 2,987 | 2,016 | 778 | 29 | 92.0% | 4 | 38.1% | 3 |
| Michigan | 7,369,957 | 3,623 | 2,034 | 785 | 27 | 74.6% | 24 | 6.4% | 19 |
| Minnesota | 3,886,311 | 1,705 | 2,279 | 880 | 17 | 73.3% | 26 | 2.1% | 31 |
| Mississippi | 1,464,224 | 1,106 | 1,324 | 511 | 47 | 49.3% | 47 | 2.4% | 30 |
| Missouri | 4,218,371 | 2,054 | 2,053 | 793 | 24 | 70.4% | 31 | 3.0% | 28 |
| Montana | 553,014 | 297 | 1,861 | 718 | 33 | 55.9% | 46 | 0.2% | 48 |
| Nebraska | 1,335,686 | 524 | 2,549 | 984 | 11 | 73.1% | 28 | 0.7% | 43 |
| Nevada | 2,543,797 | 767 | 3,315 | 1,280 | 3 | 94.2% | 3 | 0.7% | 42 |
| New Hampshire | 793,872 | 644 | 1,233 | 476 | 50 | 60.3% | 40 | 7.2% | 14 |
| New Jersey | 8,324,126 | 2,920 | 2,851 | 1,101 | 6 | 94.7% | 2 | 39.4% | 1 |
| New Mexico | 1,594,361 | 827 | 1,929 | 745 | 30 | 77.4% | 21 | 0.7% | 44 |
| New York | 17,028,105 | 4,092 | 4,161 | 1,607 | 2 | 87.9% | 12 | 8.7% | 11 |
| North Carolina | 6,301,756 | 4,609 | 1,367 | 528 | 46 | 66.1% | 36 | 9.5% | 10 |
| North Dakota | 402,872 | 184 | 2,192 | 846 | 20 | 59.9% | 41 | 0.3% | 47 |
| Ohio | 8,989,694 | 4,420 | 2,034 | 785 | 28 | 77.9% | 20 | 10.8% | 8 |
| Oklahoma | 2,485,029 | 1,307 | 1,902 | 734 | 31 | 66.2% | 35 | 1.9% | 34 |
| Oregon | 3,104,382 | 1,107 | 2,805 | 1,083 | 8 | 81.0% | 18 | 1.2% | 40 |
| Pennsylvania | 9,991,287 | 4,705 | 2,123 | 820 | 22 | 78.7% | 19 | 10.5% | 9 |
| Rhode Island | 955,043 | 401 | 2,384 | 920 | 14 | 90.7% | 7 | 38.3% | 2 |
| South Carolina | 3,067,809 | 2,382 | 1,288 | 497 | 48 | 66.3% | 34 | 7.9% | 13 |
| South Dakota | 461,247 | 226 | 2,038 | 787 | 26 | 56.7% | 44 | 0.3% | 46 |
| Tennessee | 4,213,245 | 2,905 | 1,450 | 560 | 43 | 66.4% | 33 | 7.0% | 16 |
| Texas | 21,298,039 | 8,746 | 2,435 | 940 | 13 | 84.7% | 15 | 3.3% | 27 |
| Utah | 2,503,595 | 915 | 2,737 | 1,057 | 9 | 90.6% | 8 | 1.1% | 41 |
| Vermont | 243,385 | 156 | 1,559 | 602 | 40 | 38.9% | 49 | 1.7% | 36 |
| Virginia | 6,037,094 | 2,665 | 2,265 | 875 | 18 | 75.5% | 22 | 6.7% | 18 |
| Washington | 5,651,869 | 2,375 | 2,380 | 919 | 15 | 84.0% | 16 | 3.6% | 24 |
| West Virginia | 902,810 | 640 | 1,410 | 544 | 45 | 48.7% | 48 | 2.7% | 29 |
| Wisconsin | 3,989,638 | 1,879 | 2,123 | 820 | 23 | 70.2% | 32 | 3.5% | 26 |
| Wyoming | 364,993 | 195 | 1,876 | 724 | 32 | 64.8% | 38 | 0.2% | 49 |
| United States | 249,253,271 | 106,386 | 2,343 | 905 | 80.7% | 3.0% | |||
| Data source: US Census Bureau. | |||||||||
Wendell Cox is principal of Demographia, an international pubilc policy and demographics firm. He is a Senior Fellow of the Center for Opportunity Urbanism (US), Senior Fellow for Housing Affordability and Municipal Policy for the Frontier Centre for Public Policy (Canada), and a member of the Board of Advisors of the Center for Demographics and Policy at Chapman University (California). He is co-author of the "Demographia International Housing Affordability Survey" and author of "Demographia World Urban Areas" and "War on the Dream: How Anti-Sprawl Policy Threatens the Quality of Life." He was appointed to three terms on the Los Angeles County Transportation Commission, where he served with the leading city and county leadership as the only non-elected member. He served as a visiting professor at the Conservatoire National des Arts et Metiers, a national university in Paris.
Photograph: Downtown Chicago from the Air (by author)


