
Americans are moving to middle-sized metropolitan areas, according to the latest Census Bureau population estimates. Between 2010 and 2015, all of the domestic migration gain was in a broadly defined middle of metropolitan areas between 250,000 and 5,000,000. Both above and below that range there were huge domestic migration losses.
Middle Sized Metropolitan Areas (250,000 to 5,000,000 Population)
Between 2010 and 2015, more than 1.4 million people moved to the metropolitan areas that had between 250,000 and 5,000,000 population in 2010. These movers came from larger metropolitan areas, as well as smaller metropolitan areas, micropolitan areas and areas that are not within these core-based statistical areas (Note). The larger metropolitan areas lost nearly 800,000 domestic migrants, while the smaller areas lost more than 600,000.
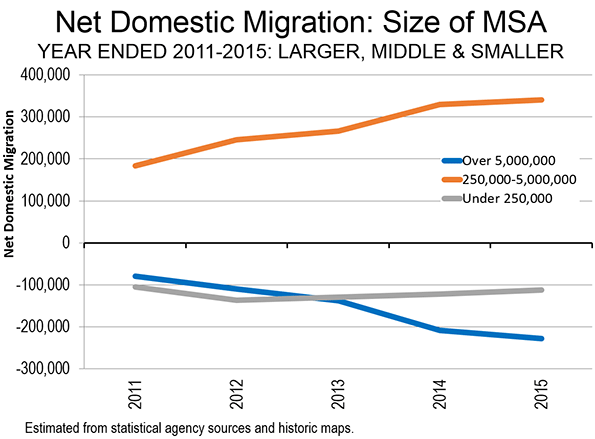
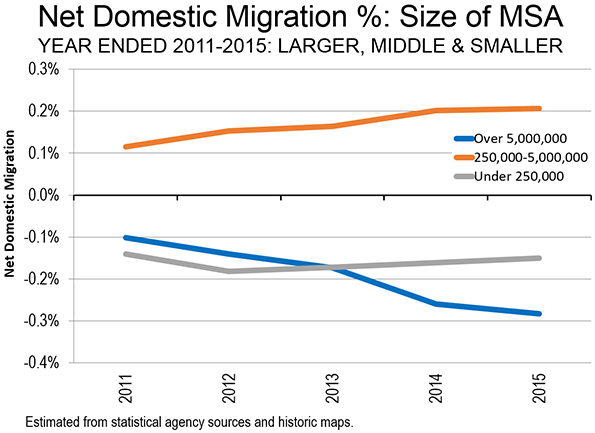
Moreover, the trend is getting stronger. In each year since 2010, the middle sized metropolitan areas have increased their net domestic migration. In 2011, the middle sized metropolitan areas gained 184,000 net domestic migrants. This has gradually moved up to the 2015 figure of 341,000 net domestic migrants (Figure 1). In percentage terms, the middle sized metropolitan areas strongly increased their net domestic migration growth as a percentage of their population, from 0.12 percent to 0.21 percent (Figure 2).
Larger Metropolitan Areas (5,000,000 Population and Over)
At the same time, the nine larger metropolitan areas with over 5,000,000 residents and more have lost net domestic migrants in every year. In 2011, the loss was 80,000. It has increased every year since, to 228,000 in 2015. The percentage losses have grown dramatically. In 2011, the larger metropolitan areas lost 0.10 percent of their population to net domestic migration. By 2015, this had nearly tripled, to a loss of 0.28 percent.
Over time, the position of our largest metropolitan regions has deteriorated, even in comparison with smaller areas. In 2011, the largest metropolitan areas, though losing, did better than the smaller areas (those with under 250,000 residents). The smaller areas lost 105,000 net domestic migrants in 2011, compared to the smaller loss of 80,000 net domestic migrants in the larger metropolitan areas.
The largest metropolitan areas continued to do better than the smaller areas in 2012, as the gap was about the same. All of that changed in 2013, as the larger metropolitan areas began to sustain larger domestic migration losses than the smaller areas. By 2014, the losses in the smaller areas were less than one-half that of the metropolitan areas with more than 5 million residents. The smaller areas, including those outside the metropolitan areas, lost 113,000 net domestic migrants in 2015, while the larger metropolitan areas lost 228,000.
These losses are all the more remarkable given that some large metros, notably Houston and Dallas-Fort Worth have been gaining net migrants, up 255,000 and 241,000 respectively. Two other metropolitan areas in the above 5,000,000 category also gained. Atlanta added 116,000 domestic migrants, albeit at a much slower rate than during the 2000s. Miami also gained, but only modestly (3,000).
The shift away from the largest metropolitan area group was driven by huge losses in the largest of the metropolitan areas in that category. New York lost 701,000 domestic migrants during the decade. Chicago lost 319,000 and Los Angeles was close behind at 280,000. Philadelphia lost 100,000, while Washington lost 13,000.
Smaller Areas (Under 250,000 Population)
Among the smaller areas, the peak loss was reached in 2012, at 136,000 net domestic migrants. Since that time, the smaller areas have improved on their net domestic migration losses modestly each year, dropping to the 113,000 in 2015. The annual domestic migration rates have been more constant in the smaller areas, starting at a loss of 0.14 percent in 2011 and fluctuating up and down to a maximum of 0.18 percent and a minimum of 0.15 percent in 2015.
More Detailed Analysis
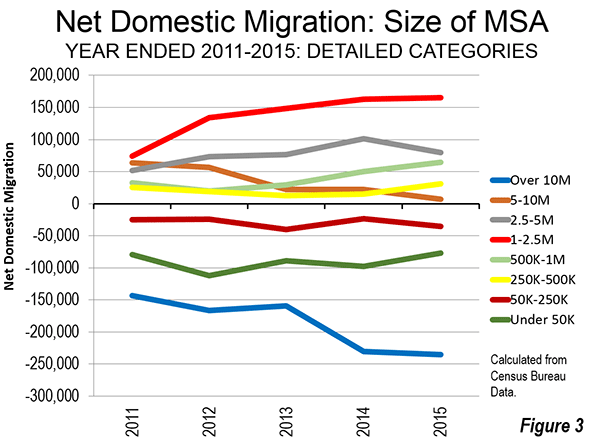
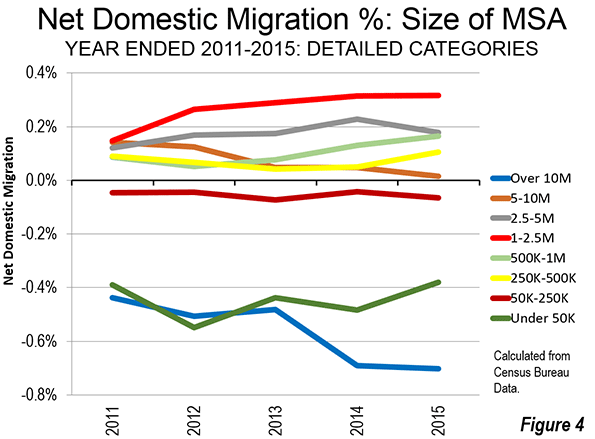
Figures 3 and 4 show the domestic migration trends in more detailed population categories. By far the largest losses have been sustained by the megacities, New York and Los Angeles, with more than 10,000,000 residents. The metropolitan areas with between 5,000,000 and 10,000,000 population had done relatively well in the early part of the decade, but have dropped substantially. If the same trend continues to next year, net domestic migration losses would occur across this category.
By far the strongest gains were in the 1,000,000 to 2,500,000 category, where net domestic migration more than doubled from 2011 to 2015. There was also strong growth in the 500,000 to 1,000,000 category and in the 250,000 to 500,000 category. There was a more mixed record among the metropolitan areas with between 2,500,000 and 5,000,000 population, with a rise to 2014, but a reduction in 2015.
The smallest categories, from 50,000 to 250,000 population and under 50,000 population lost in each year, though there were not large fluctuations.
A Trend?
The trend that favors the migration from the largest and smallest areas to the broad middle of metropolitan areas may be an aberration. But we may see an even larger share of future domestic migration to middle-sized metropolitan areas, together with two or three larger areas (Houston, Dallas-Fort Worth and maybe Atlanta).
Note: Core based statistical area is a term that includes metropolitan areas and micropolitan areas, which are larger and smaller labor market areas, with slightly different definitions. Additional information can be obtained from the Office of Management and Budget.
Wendell Cox is principal of Demographia, an international pubilc policy and demographics firm. He is a Senior Fellow of the Center for Opportunity Urbanism (US), Senior Fellow for Housing Affordability and Municipal Policy for the Frontier Centre for Public Policy (Canada), and a member of the Board of Advisors of the Center for Demographics and Policy at Chapman University (California). He is co-author of the "Demographia International Housing Affordability Survey" and author of "Demographia World Urban Areas" and "War on the Dream: How Anti-Sprawl Policy Threatens the Quality of Life." He was appointed to three terms on the Los Angeles County Transportation Commission, where he served with the leading city and county leadership as the only non-elected member. He served as a visiting professor at the Conservatoire National des Arts et Metiers, a national university in Paris.


Middle-size cities - a great economic secret weapon
This is especially interesting, because as "The Economist" pointed out in its article "Concrete Gains", a particular strength of the US economy was its abundance of strong middle-size cities. Many national economies have urban growth restrictions that severely restrict the potential of all their cities, but there tends to be one "major" incumbent one that benefits from the lack of competition. Think London in the UK. The UK economy has a serious productivity gap that has no better explanation than the long-prevailing Town and Country Planning system. Even their "rust belt" cities still have unaffordable housing, in spite of its average density being far higher than comparable US cities with far greater growth. Liverpool has a median multiple over 7 now in spite of tracking Detroit in population and industry loss, and in spite of being around 3 times denser, still, than typical US cities.
Germany would be another reasonably good example of a nation with many productive medium-size cities and in fact they have no equivalent of London, Paris or New York in terms of a city with "primacy".