
The Port of Shanghai is by far the largest seaport in the world, according to the authoritative 2014 figures published by the American Association of Port Authorities. AAPA is an "alliance of the ports of Canada, the Caribbean, Latin America and the United States."
Ranking seaports is no simple matter. There are two fundamental rankings, Cargo tonnage and containers. Containers are measured in "20 foot equivalent units," or TEU's. Cargo tonnage, for example, includes bulk commodities, such as copper or oil. Cargo tonnage is unloaded at ship side and transferred to another mode of transport (such as freight rail or truck) to continue toward its destination. Containers are intermodal, meaning that they can be directly transferred from the ship to other modes of transport without being emptied.
Shanghai leads the world in both cargo tonnage and container volume. This supremacy was achieved only recently. Singapore had been the premier world port in both tonnage and containers during the much of the 2000s. Shanghai became dominant in cargo in the middle 2000's and overtook Singapore in containers by 2010.
Container Volumes
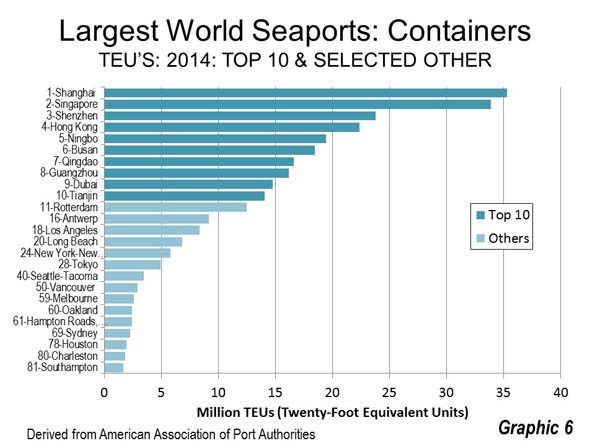
All of the largest container ports are in Asia with Rotterdam being the largest non-Asian port at number 11. Seven of the top 10 are in China.
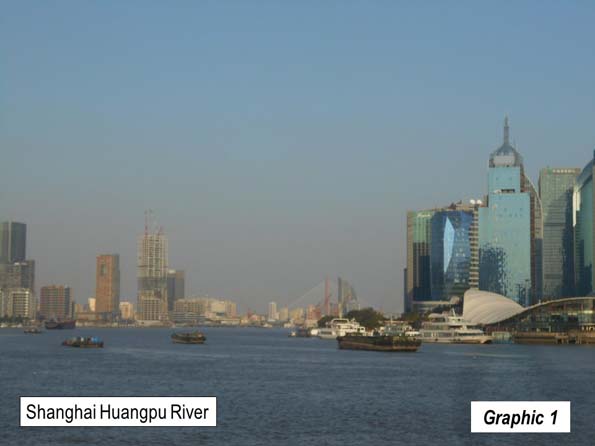
Top ranking Shanghai handles more than 36 million TEUs annually. The port of Shanghai includes facilities on the Huangpu River (Graphic 1), which flows through the city and the Bund, the Yangtze River and the new offshore Yangshan Deepwater port in the mouth of Hangzhou Bay (Photo above). This facility was opened in the middle 2000's for container traffic and is connected to the mainland by the 33 kilometer (20 mile) long Donghai bridge.
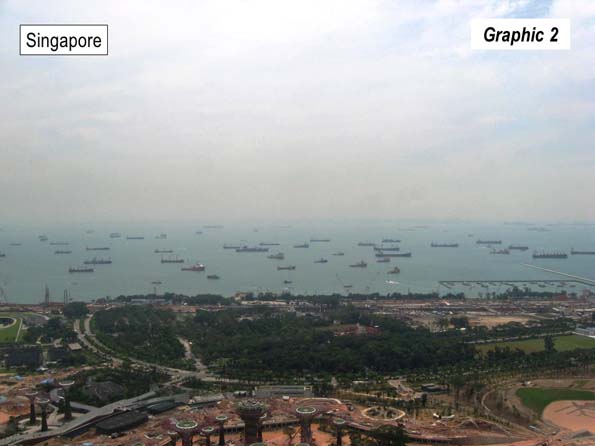
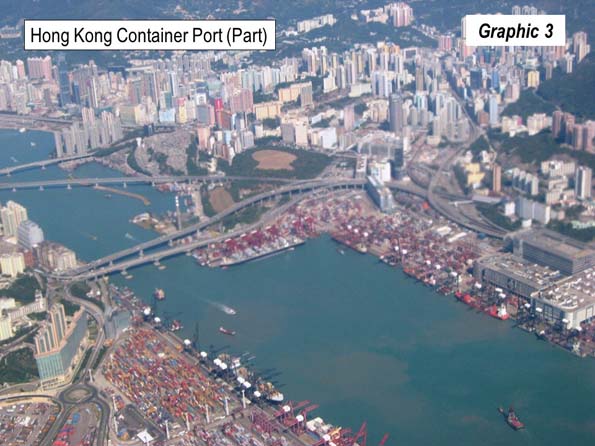
Singapore is the second largest container port, handling nearly 34 million TEUs (Graphic 2). Shenzhen, just across the border from Hong Kong is the world’s third largest port, well behind Singapore, with 24 million TEUs. Hong Kong ranks fifth, and was the largest in the container port in the world until displaced by Singapore in the early 2000's (Graphic 3).
Ningbo, less than 80 kilometers (50 miles ) across Hangzhou Bay from the port of Shanghai is the world's fifth largest container port.
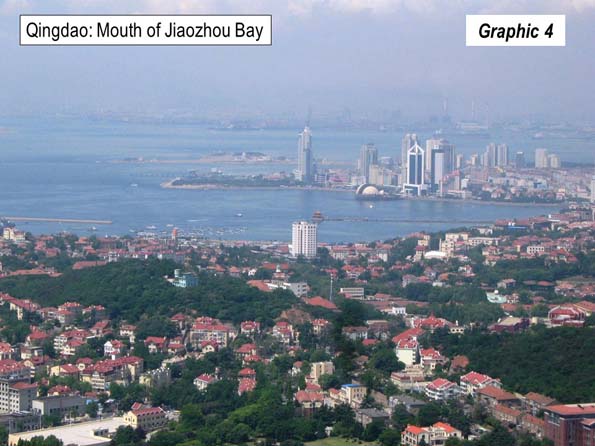
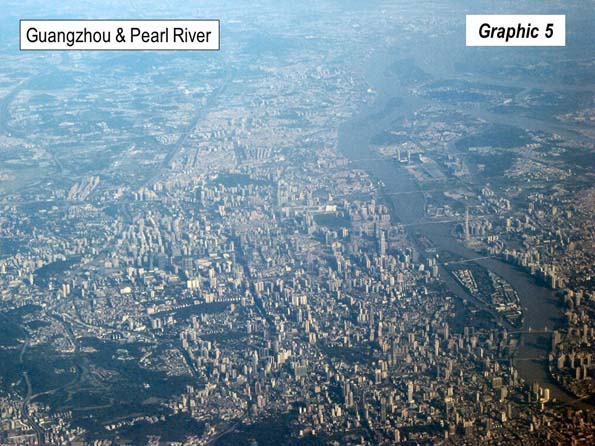
Busan, in South Korea ranks sixth. Qingdao, on China's Shandong peninsula is the seventh largest (Graphic 4). Guangzhou ranks 8th (Graphic 5) and Dubai ranks 9th. Tianjin, located in China's fourth largest urban area, is approximately 160 kilometers (100 miles) from Beijing.
Graphic 6 shows the 10 largest container points in the world and selected additional ports.
Cargo Volumes
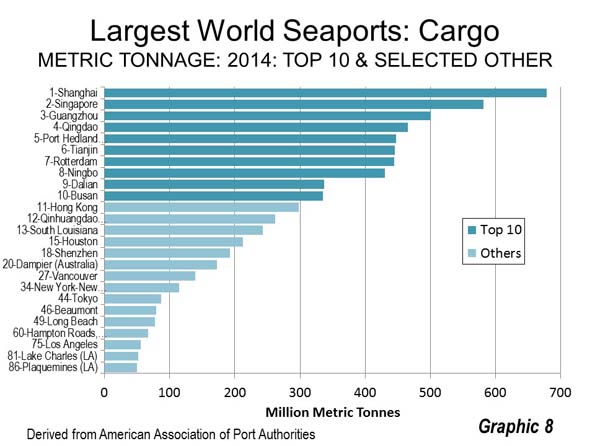
Twelve of the largest cargo ports in the world are in Asia, with the exception of Port Hedland, in the state of Western Australia's resource-rich Pilbara region. This is the largest non-Asian port (#5). Eight of the top 12 ports are in China.
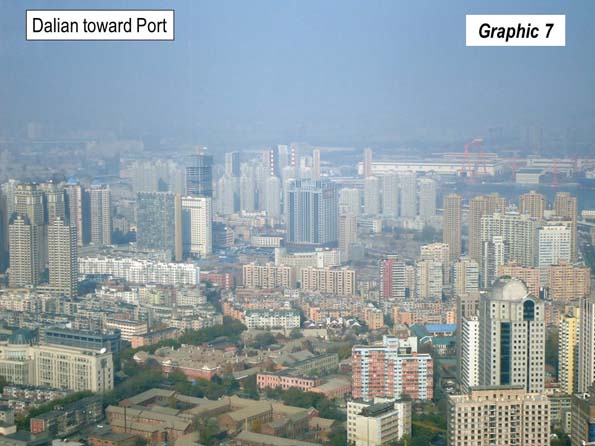
In 2014, the port of Shanghai handled approximately 680 million tons of cargo (Note). Singapore was ranked second with approximately 580 million tons. Guangzhou and Qingdao were the third and fourth largest cargo ports. Port Hedland, was the fifth largest cargo port. Three of the second five were located in China, including #6 Tianjin, #8 Ningbo and #9 Dalian (Graphic 7), Manchuria's largest cargo port.
Rotterdam was the seventh largest cargo port and the largest port in Europe, though had dropped from being the largest in the early 2000's, before it was overtaken by Singapore. Busan was the 10th largest cargo port.
Graphic 8 shows the 10 largest cargo points in the world and selected additional ports.
Large Port Regions
China, with most of the world's largest ports has considerable regional port concentrations. The two Yangtze Delta ports (Shanghai and Ningbo) had approximately 1.1 billion tons of cargo and 52 million TEU's. The Pearl River Delta ports (Guangzhou, Hong Kong and Shenzhen) handle nearly 1.0 million tons of cargo and 57 million TEU's. The Bohai Bay ports (Tianjin and Qinhuangdao), to the east of Beijing account for more than 700 million annual tons of cargo and a much more modest 14 million TEUs.
The adjacent Los Angeles and Long Beach ports also handled 14 million TEU's in 2014. The Tokyo Bay ports (Tokyo, Yokohama and Chiba) processed 7 million TEU's while the port of New York and New Jersey handled 6 million.
Other large regional cargo port concentrations lie along Louisiana's lower Mississippi River (the ports of South Louisiana, New Orleans, Baton Rouge and Plaquemines), with cargo tonnage of 430 million, The Tokyo Bay ports handle 370 million tons annually. The adjacent ports of Los Angeles and Long Beach process 130 million tons of cargo annually. Historically prominent ports, such as New York and London have smaller volumes (115 million and 45 million respectively).
The Ascendance of Asia
The big story in port statistics is the ascendance of Asia, especially China. It was not a long time ago that European ports were the largest. Recently published research indicates that Asian container shipments between China and Europe/North America in 2012 were five times their 1990 rate. This compares to an approximate doubling between Europe and North America over the period. The result is that European and North American ports no longer dominate the statistics.
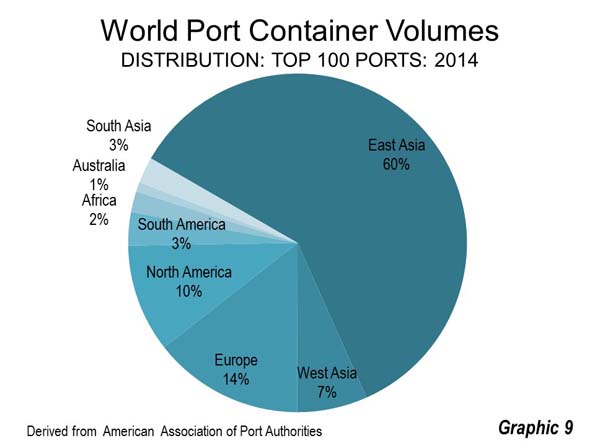
In 2014, East Asia accounted for 60 percent of the container volume among the 100 largest ports. This is four times the volume of European ports (14 percent) and six times that of North American ports. All of the rest of the world accounts for only 16 percent of the total (Graphic 9).
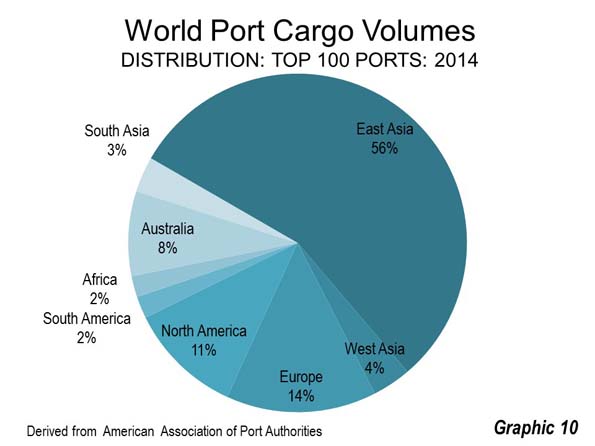
The distribution of cargo traffic is similar. East Asia accounts for 56 percent of the top 100 port volume, four times the volume of Europe (14 percent) and five times that of North America (11 percent). Australia accounts for 8 percent, 60 percent of which is attributable to the Western Australian terminals of Port Hedland and Dampier, with their substantial commodity shipments to China. The rest of the world accounts for 11 percent of volumes (Graphic 10).
The world of ports is by no means static. With the expanded Panama Canal now in operation, the maximum capacity of container ships has been nearly tripled. This means that US Gulf of Mexico and Atlantic ports are more competitively positioned by being able to berth the larger ships originating from Asia. This permits substitution, for example, of longer and less costly ocean voyages for intermodal truck and rail shipment across the United States,
According to China Daily, Maersk, the largest container ship company in the world, is routing its Asia to US East Coast traffic through the Panama Canal. A Maersk press release said ”Using the new Panama Canal locks, Maersk Line is able to significantly reduce the transit days from Asian to North American ports. The transit times from Shanghai and Ningbo to Newark, Norfolk and Baltimore are now five to 10 days faster,." James Newsome of the South Carolina Ports Authority described to China Daily the economics that now favor Atlantic ports: "...if Asian cargo bound for Charlotte, North Carolina, landed in Los Angeles, it would cost $2,000 to send it across the US by rail. If it landed in Charleston, it would cost only $600 by truck."
Gulf of Mexico ports as US shippers become more competitive from lower costs. A natural gas shipment from the Gulf Coast would save 5,000 nautical miles (5,750 miles) and nine days using the canal, according to Martin Houston of Tellurian Investments.
A number of Gulf and Atlantic ports are investing in improved infrastructure to accommodate the new traffic and larger ships. This includes ports like Houston, Savannah, Charleston (South Carolina), Miami and others. Perhaps the most impressive investment is raising the historic Bayonne Bridge so that the Port of New York and New Jersey can accommodate the larger ships.
Of course the winners in this changing world will be consumers, who can expect lower prices as shipping becomes less expensive.
Note: AAPA urges caution in interpreting cargo tonnage figures, because of differing tonnage definitions.
Wendell Cox is principal of Demographia, an international pubilc policy and demographics firm. He is a Senior Fellow of the Center for Opportunity Urbanism (US), Senior Fellow for Housing Affordability and Municipal Policy for the Frontier Centre for Public Policy (Canada), and a member of the Board of Advisors of the Center for Demographics and Policy at Chapman University (California). He is co-author of the "Demographia International Housing Affordability Survey" and author of "Demographia World Urban Areas" and "War on the Dream: How Anti-Sprawl Policy Threatens the Quality of Life." He was appointed to three terms on the Los Angeles County Transportation Commission, where he served with the leading city and county leadership as the only non-elected member. He served as a visiting professor at the Conservatoire National des Arts et Metiers, a national university in Paris.
Photo: Yanghsan Intermodal Port, Shanghai (All photos by author)


