
The Economy of Cities
Cities have been called “engines of growth”. What does that mean?
Fly over a major city and what do you see? Not well defined centers and sub-centers. More likely, an amazing complexity. We argue that what is actually down there, but hard to actually see, is a large number of superimposed and spatially realized supply chains.
In big cities like Los Angeles, we are well served by large numbers of people (mostly strangers) arranged in complex and usually unfathomable supply chains Their incredible (and hidden) complexity is not a problem. Shopping is simple; we look at prices and the reputations of sellers and products. Markets illustrate the stark contrast between how much we get vs how little we have to know.
Market competition also means a scramble for new ideas. The best performing firms form new ideas first. There are supply chains for things and supply chains for ideas. The latter are harder to identify but clearly essential. New ideas come before new things. Mokyr (2002) notes that we are all on the lookout for useful knowledge.
Managers are charged with the challenge of deciding what to make vs what to buy. But the choices require a decision of what to buy where? What is available where?
Cities are engines of growth because the settlement patterns that evolve (survive) are ones that provide good access – to things we may want to buy and to ideas we may want to hear about and learn about.
What Kind of City?
The question here is what kind of city is most congenial to the kind of network formation required for all this to work?
Urban economists and geographers once described the evolution and spread of cities as an evolution from “pedestrian city” to “streetcar city” to “automobile city” (Mueller, 2004). But this has been elaborated and updated. Baldwin (2016) describes how economic geography changed as various advances lowered trading costs and communications costs. He separates face-to-face costs from communications costs; the former are the constraint to a “flat world”. The partition recognizes the special nature of tacit information exchange. We do many things electronically but we still travel to meetings, near and far.
This has led some to assume that dense, traditional cities possess intrinsic advantages. Although some of these are relevant, evidence is that different urban forms can also function successfully.
Cities can achieve efficiencies in different ways. Delivering goods or ideas can occur via many modes or media. Possibilities, costs and choices change as technologies evolve, e.g. transactions costs, location choice and urban form evolve. All this suggests that evolving and adapting cities --- of differing forms— constitute an essential part of durable economic growth. Just as price discovery is a market process, so is supply chain formation -- and chains’ spatial arrangements.
What matters more than form is the ability to allow the market to function. Economic efficiencies cannot be achieved top-down; top-down involvement must maintain a light touch. Rules should be simple and clear. Approvals that are complex and politicized must be clarified and simplified. There might also be a balance whereby landowner’s rights are not swamped by neighbors’ rights to stop (politicize) development.
We all have many chains in our lives; we participate in many supply chains as buyers and as sellers. This includes going to work, where we sell our labor. All of us choose (compete for) locations in light of these many interests. This suggests that we are eager to find and secure locations that facilitate our performance in the many supply chains we are involved in. This defines how we get the cities we have.
Boundaries and Geography
Drawing boundaries is never simple. Where does the city or region begin and end? The same is true for important features within cities. What constitutes or defines the center, the downtown, the major sub-centers? Where do “suburbia and “exurbia” begin and end? And what happens beyond these centers, sub-centers, clusters and agglomerations?
Economists who study cities often describe them via just one number, the (average) density. How can that be adequate? Cities are complex and distinguished by their peculiar locational arrangements. Most studies of city success rely on simple metropolitan area average densities for the simple reason that these are easily found. Yet it is a leap to describe large and complex places via one single number. Consider that Los Angeles --- which does not achieve almost anywhere the densities common to Manhattan or San Francisco --- has been the densest urbanized area in the U.S. since approximately the mid- 1980s. The factoid illustrates the problem of relying on just one number.
Map 1 of the location San Francisco Bay Area software firms illustrates the complexities. Does the Bay Area’s overall population density – considerably less than that of Los Angeles, much less than Manhattan – signify anything? Where does the Silicon Valley a “cluster” or an “agglomeration” begin and where does it end? Were the map a three-dimensional density surface, there would be peaks as well as low-rise hills. Which ones are sub-centers or clusters?
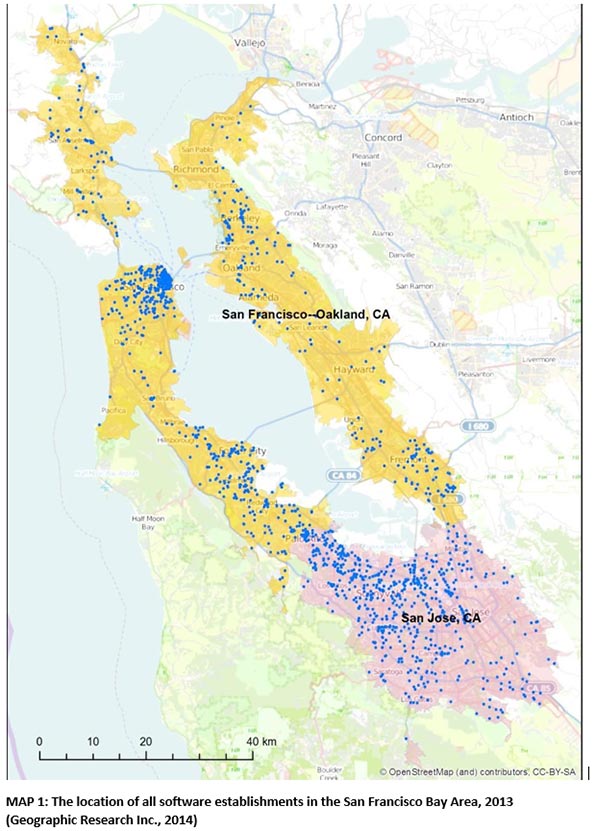
The standard labels fall short. Settlement patterns are complex -- and emergent. Being near or far from “the action” can be many things. It also involves many possible trade-offs. Less expensive homes for workers? Better schools? Less commuting? Any industry includes many players who will avail themselves of many choices along the ranges of many possible trade-offs.
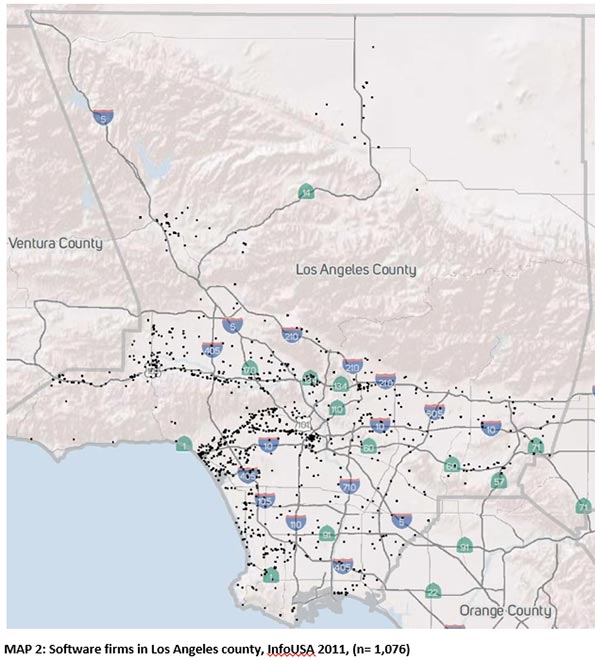
Map 2 plots locations of software firms in Los Angeles County. The same variety of arrangements and the same questions apply. But both of our maps show that the spread of software firms is always lumpy, but is also dispersed widely.
Here is one example, from a large literature, of the challenges. Bumsoo Lee (2007) applied several centers identification strategies to the study of employment in major U.S. metropolitan areas. According to one such method, MSAs of more than 3 million inhabitants had roughly 7 percent of jobs in the central business district, 15 percent in the various sub-centers and the remaining 78 percent “dispersed”, outside of any identified center.
What L.A. Data Tell Us
Data on production functions are widely available. Geographically detailed data on the locations of firms are becoming available. In a recent study of Los Angeles, we used two data sources. The first was InfoUSA 2011 with data on businesses in 6,395 census block groups in Los Angeles County. The InfoUSA data indicate business locations with number of employees by NAICS (2007) industrial sector. These were aggregated to create the sectors we wanted to study such as Software and Biotech.
We tabulated Los Angeles area co-locations of firms. Employment and firms were spatially aggregated by Census Block Group. The aggregated jobs and firms are divided by the size (acres) of the Census Block Group to calculate employment and firm densities. The median-size Census Block Group in L.A. County is 79 acres. These data were useful for, among other things, calculating pair-wise co-location coefficients. These became dependent variables in multiple regression tests.
The second data source is US IMPLAN input-output 2013, originally with 536 sectors which were also aggregated to the industrial sectors we were interested in. The technological coefficients, proportions of sector-to-sector purchases, were the independent variables used to test their effects on the observed co-locations of firms.
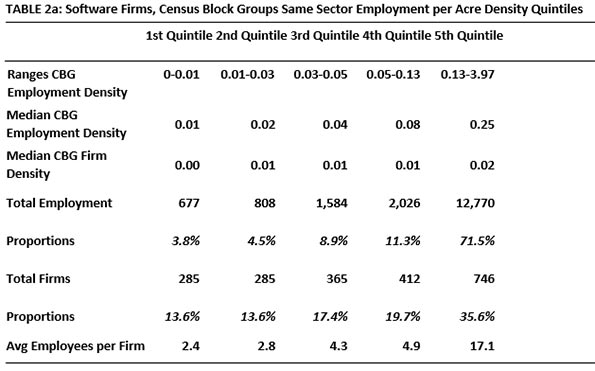
What kind of spatial arrangements do we see? To avoid the problem of identifying centers and subcenters – and leaving out all the other places, people and jobs -- we computed density quintiles. Looking at the number of firms and their sizes in each density quintile, we found that they might or might not be arranged in compact geographic clusters. That’s what our two maps suggest.
Table 1 summarizes our findings on firm location in the two densest quintiles. For the large sectors, three kinds of densities were tabulated: for all firms of the sector, for all firms in all sectors and for all firms in all sectors except the sector being studied.
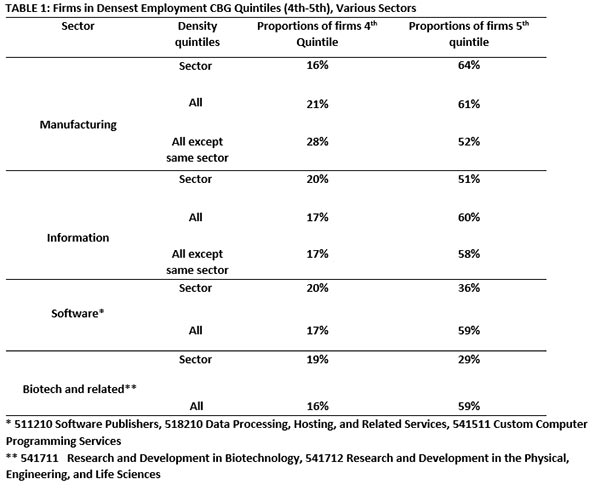
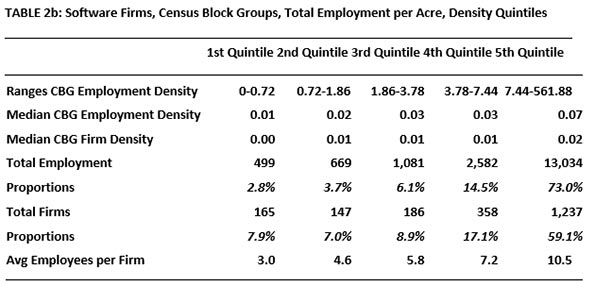
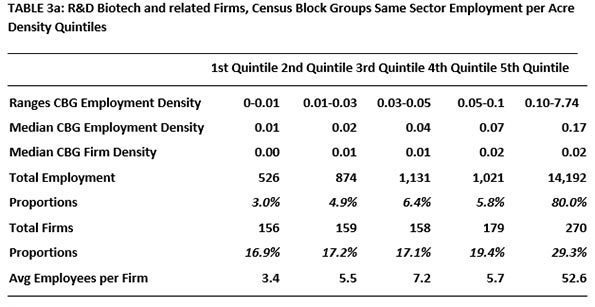
The two subsectors studied here, Software and Biotech, are prominent in the modern world and unique enough to merit their own categories. They employ about the same number of people in LA County. But these two sectors differ in important ways. Software firms have service as well as research functions. Biotech is more weighted toward the research side. In addition, biotech is the more regulated of the two, most significantly subject to Federal Drug Administration vetting and ruling. “The estimated average pre-tax industry cost per new prescription drug approval (inclusive of failures and capital costs) is: $2,558 million.” (DiMasi, et al 2014). All this suggests greater risk and generally larger firm sizes.
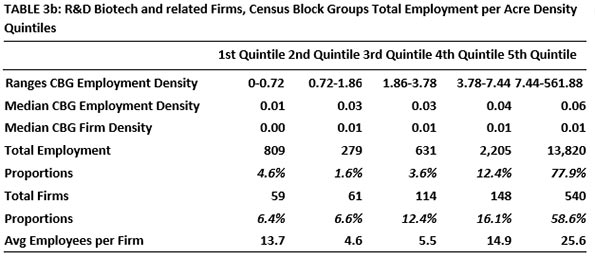
When it comes to total industry clusters, medium-sized Biotech firms are in the least dense areas; this cannot be said of Software firms. As in the story of the more aggregated sectors, clustering (with same sector firms as well as with others) is apparent. But there are prominent exceptions. Scooping up ideas can be initiated remotely. Some firms are able to do less up-close interacting and complementing it with the virtual alternative. The blends vary.
Large proportions of Software and Biotech firms choose the dense quintiles in similar proportions. These agglomerate even though economizing on shipping is not their big concern. As expected, more of the larger Biotech firms are less likely to seek clusters.
Firm size differences are also interesting. The largest Software firms (by number of workers) prefer the highest density quintile, whether densities refer to all firms or just same-sector firms. It is not the same for Biotech firms, where many of the medium-sized firms prefer the lowest density quintile, as defined for sectors of all firms. In this sector, that size may be good for internal R and D and information gathering and creation.
Does density matter? By all means but it is complex. Even for firms in sectors that deal more in information than physical product, nearby densities (of same-sector and well as other-sector) do affect location choice. An interest in establishing networks by which ideas can be shared can explain this. Idea sharing is complex and still requires some degree of nearness. Over 50 years ago, Mel Webber wrote about “Community without Propinquity” (1963). This was years before there was an internet but Webber deserves credit for calling our attention to the fact that we seek and form a variety of very complex links that help explain our locational preferences.
Peter Gordon is Emeritus Professor, USC Price School of Public Policy. His current research addresses how the nature of cities impacts economic growth prospects. John Cho is Associate Regional Planner at the Southern California Association of Governments. His interests involve transportation networks and their effects on regional development.
REFERENCES
Baldwin, Richard (2016) The Great Convergence. Cambridge, MA: Belknap.
DiMasi, Joseph A. and Henry G. Grabowski and Ronald W. Hansen (2014) Innovation in the Pharmaceutical Industry: New Estimates of R&D Costs. Boston: Tufts Center for the Study of Drug Development, Tufts University.
Lee, B. (2007). "Edge" or "edgeless" cities? Urban spatial structure in U.S. metropolitan areas, 1980 to 2000. Journal of Regional Science, 47(3), 479-515.
Mokyr, Joel (2007) “The Market for Ideas and the Origins of Economic Growth in Eighteenth Century Europe” Tijdschrift Voor Sociale en Economische Geshiedenis, 4.
Muller, Peter O. (2004) “Transportation and Urban Form: Stages in the Spatial Evolution of the American Metropolis” in S. Hanson (ed.) The Geography of Urban Transportation (3rd ed.) Guilford Press.
Webber, M.M. (1963) “Order in Webber Diversity: Community without Propinquity” in Cities and Space, Lowdon Wingo (ed.) Baltimore: Johns Hopkins University Press.


