
This article examines median residential property tax levels and rates among the nation’s 53 major metropolitan areas (over 1,000,000 population). The data is from the 2016 American Community Survey and is self reported by consumer respondents (not from governments or public records).
Highest Property Tax Burdens
Property owners in the New York, NY-NJ-PA metropolitan area pay by far the highest real estate taxes among the major metropolitan areas. New York, at $7,471, is the most expensive by a wide margin. Second place San Jose is about a quarter lower, with a median annual property tax of $5,705. Third place Hartford is another 11 percent lower, at $5,092. San Francisco ($4,957) and Chicago ($4,938) are slightly lower (Figure 1). Each these metropolitan areas has much of its population in a state with generally high taxes, and the one interstate metropolitan area (New York), is split principally between two states with solid reputations for high taxes (New York and New Jersey, ranked worst and second worst by the Tax Foundation).
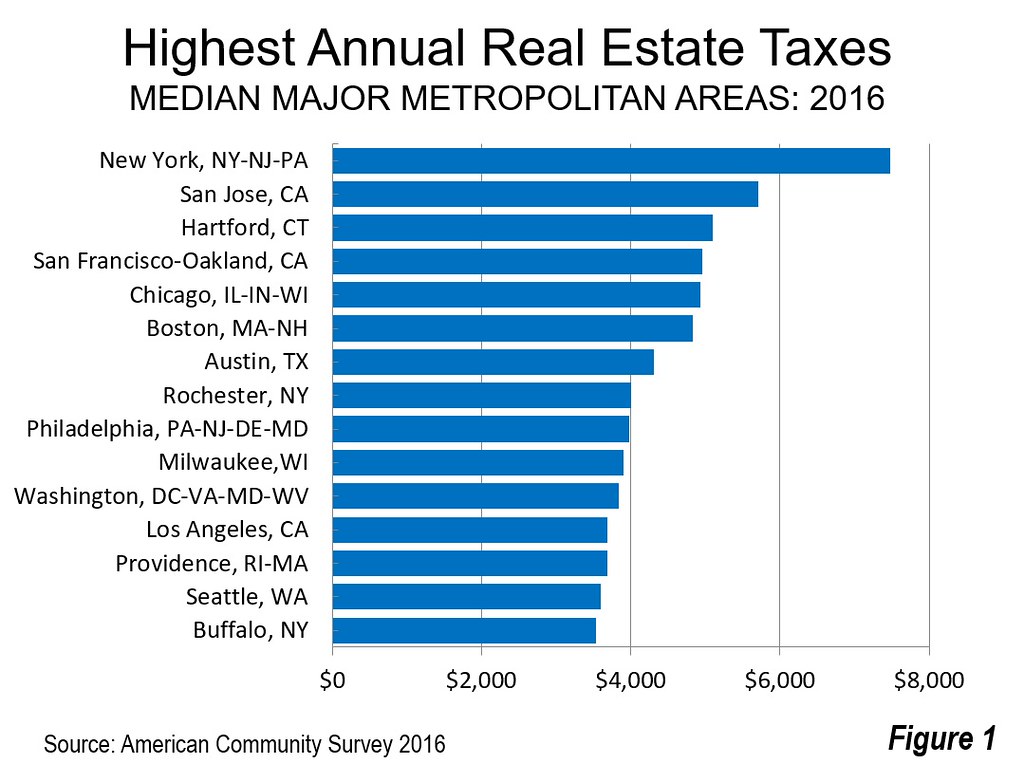
The second five among the highest median property taxes are also generally in higher tax areas, with one exception, Austin, Texas. Texas is generally a lower tax state, so Austin's rank as the seventh most expensive may be surprising. Property taxes are comparatively high in Texas, which does not have an income tax. Sixth ranked Boston (MA-NH) has the sixth highest property taxes, while Rochester, Philadelphia (PA-NJ-DE-MD) and Milwaukee occupy positions 8 to 10.
The third five also includes high tax areas, including Washington (DC-VA-MD-WV), Los Angeles, Providence (RI-MA), Seattle and Buffalo.
Among the 15 most expensive metropolitan areas for property taxes, six are among the 10 largest in population, New York, Chicago, Boston, Philadelphia, Washington and Los Angeles.
Three of California's major metropolitan areas are also in the most expensive 15. As a high tax state, this is not surprising, but California has often been characterized as a low property tax state (due to Proposition 13). California's far higher property values drive its larger tax bills.
Lowest Property Tax Burdens
All of the least costly property tax metropolitan areas are in the South or the intermountain West. Birmingham has the lowest median property taxes, at $775 annually, and is alone in having annual taxes below $1,000. New Orleans, Indianapolis, Louisville (KY-IN) and Phoenix make up the balance of the lowest five. Eight of the metropolitan areas ranked from 6th to 15th lowest are in the South, including Nashville, Oklahoma City, Tampa-St. Petersburg, Memphis (TN-MS-AR), Charlotte (NC-SC), Jacksonville, Atlanta and Orlando. The intermountain West is represented by two, Las Vegas and Tucson (Figure 2). The least expensive 15 metropolitan areas include only one of the 10 largest in population, Atlanta.

Highest Median Property Tax Rates
The median tax rates are estimated based on the reported median house values from the American Community Survey (these reflect survey results, not tax rate information from primary assessment sources).
The highest estimated median property tax rates are Rochester and Buffalo, at approximately 2.8 percent and 2.5 percent respectively. Chicago and Hartford also have rates exceeding 2.0 percent. Milwaukee and Cleveland are ranked with the fifth and sixth highest rates. The two Texas metropolitan areas, both among the largest five in the nation, are ranked seventh and eighth highest, Houston and Dallas-Fort Worth. San Antonio has the tenth highest estimated median property tax rate. However, none of these three Texas metropolitan areas appear among those with the highest property tax burdens, in part because Texas property values that are lower and more reflective of the national market (Figure 3).
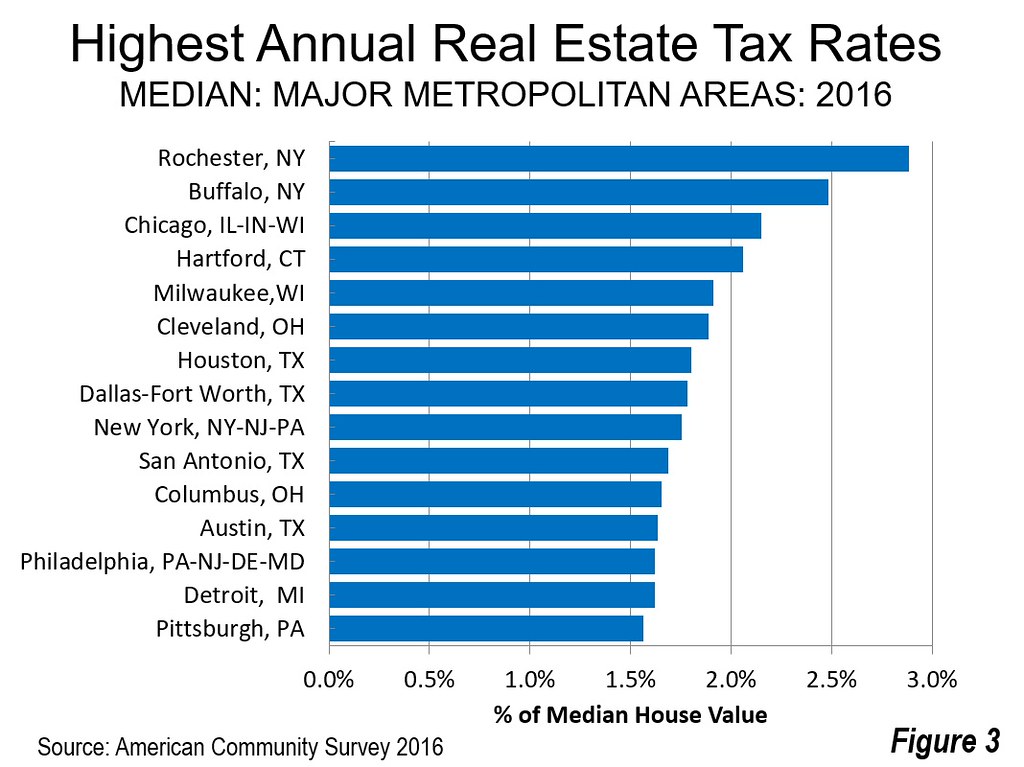
New York, which has the highest property tax burden (above), has the ninth highest estimated property tax rate. The one Texas exception is Austin, which has the 12th highest estimated tax rate and also has among the highest tax burdens in the nation (seventh highest).
Five of the nation's 10 largest metropolitan areas (in population) are among those with the highest estimated median property tax rates, Chicago, Houston, Dallas-Fort Worth, New York and Philadelphia.
Lowest Estimated Property Tax Rates
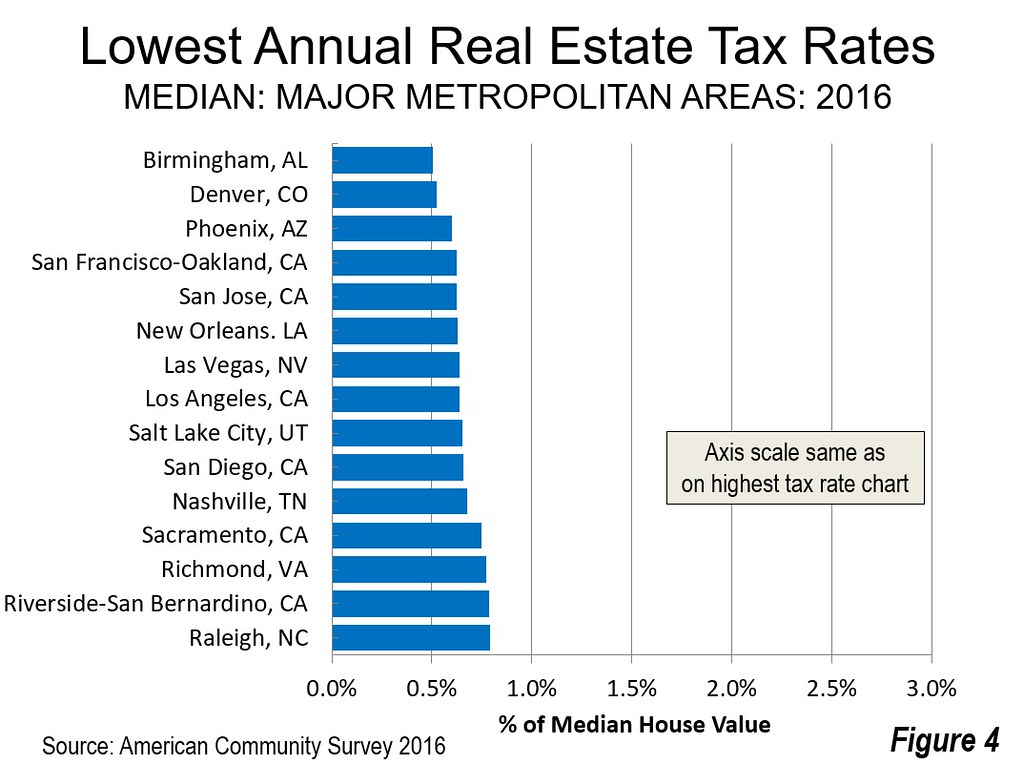
The effect of California's Proposition 13 is evident among the 15 major metropolitan areas with the lowest estimated median property taxes. All six of California's major metropolitan areas are on the list, San Francisco at fourth lowest, San Jose (5th), Los Angeles (8th), San Diego (10th), Sacramento (12th) and Riverside-San Bernardino (14th). However, all but Riverside-San Bernardino have actual median property tax burdens at least 40 percent higher than the national major metropolitan area median ($2,502). Riverside-San Bernardino scores at the median. Moreover, California's generally higher property tax burdens combine with its progressive income tax, with rates that outstrip those of the other two most expensive states, Oregon and Minnesota, by more than one-third.
The lowest tax rate, like the lowest tax burden, at 0.5 percent in Birmingham, while Denver has the second lowest tax rate (Figure 4).
Use of the Data
This kind of data is important to corporations as they site new facilities, consider moves and expand or contract the size of their operations as they consider factors likely to impinge especially on labor compensation. However, at the metropolitan area level, median property tax data is only one of many indicators, and comparisons limited to this (or any other state and local tax indicator below the aggregate level) can be misleading. Moreover, median home owner property taxes may have little correlation with commercial or industrial property taxes, which are of particular importance in business investment. And, of course, that doesn’t include income taxes, a quite onerous burden in some states.
Further, all of the metropolitan areas have multiple local property tax jurisdictions. This starts at the state level, where, for example, Philadelphia is in four states as is Washington, which is also in the District of Columbia. States (and DC) rely to varying degrees on property taxes. This limits the effectiveness of property tax comparisons, because the "bottom line" of taxation, the total tax burden, includes many taxes. Moreover, governmental responsibilities vary considerably between the states. For example, one of the largest state and local expenditure categories is primary and secondary education. In Hawaii, this is a state function. In most other states, primary and secondary education is a local function, usually independent school districts, but in some case, county run schools, while in others, municipalities perform that function. Most states have state income taxes and sales taxes. All of this complicates consideration of state and local taxes and expenditures.
In a report for the Association of Towns of the State of New York (Government Efficiency: The Case for Local Control), we found that local governments were spending from a low of 20 percent of state and local taxation in Hawaii to 68 percent in Nevada. Local tax revenues were similarly dispersed, with a low of 13 percent of state and local revenues in Vermont to 55 percent in New York. Because of these variations, comparing state or local taxation and expenditures is generally invalid except within the same state. Comparisons between states, even at the local level, should include both state and local spending. Even so, caution is required in state to state comparisons.
Wendell Cox is principal of Demographia, an international public policy and demographics firm. He is a Senior Fellow of the Center for Opportunity Urbanism (US), Senior Fellow for Housing Affordability and Municipal Policy for the Frontier Centre for Public Policy (Canada), and a member of the Board of Advisors of the Center for Demographics and Policy at Chapman University (California). He is co-author of the "Demographia International Housing Affordability Survey" and author of "Demographia World Urban Areas" and "War on the Dream: How Anti-Sprawl Policy Threatens the Quality of Life." He was appointed to three terms on the Los Angeles County Transportation Commission, where he served with the leading city and county leadership as the only non-elected member. He served as a visiting professor at the Conservatoire National des Arts et Metiers, a national university in Paris.
Photograph: New York City Hall
https://upload.wikimedia.org/wikipedia/commons/thumb/b/b6/New_York_City_...


