
Planners and journalists are often uneasy about suburban development, wondering how people will get to work in the center from more distant locations. They needn’t worry. Only a relatively small percentage of people work in the center (generally less than 10 percent). Indeed the residential employment dispersion in American metropolitan areas has been a major factor in keeping work trip travel times among the shortest in the world.
In a ground breaking 2007 research paper, economists Bumsoo Lee and Peter Gordon cited William T. Bogart, now president of Maryville College (Tennessee), to dismiss the pervasive idea in planning, media and academic circles that American metropolitan areas (cities in their economic or functional form) still exhibit the monocentric form that ceased to be long ago.
“A fundamental misunderstanding of how metropolitan areas work has hampered the current debate on the causes and consequences of urban sprawl. This misunderstanding is analogous to the pre-Copernican fallacy that the earth is the center of the universe, and everything revolves around the earth. In the discussion of urban sprawl, the downtown or central city takes the place of the earth in the Ptolemaic cosmology, and the rest of the metropolitan area is defined only in relation to the downtown.”
In their research, Lee and Gordon showed that as early as 2000, no major metropolitan area (over 1 million population) in the United States had a monocentric employment pattern. Indeed, they showed that US metropolitan areas were already more polycentric than monocentric. That includes New York, where more than 75 percent of employment was outside the monocentric core (the central business district or CBD) and other major subcenters.
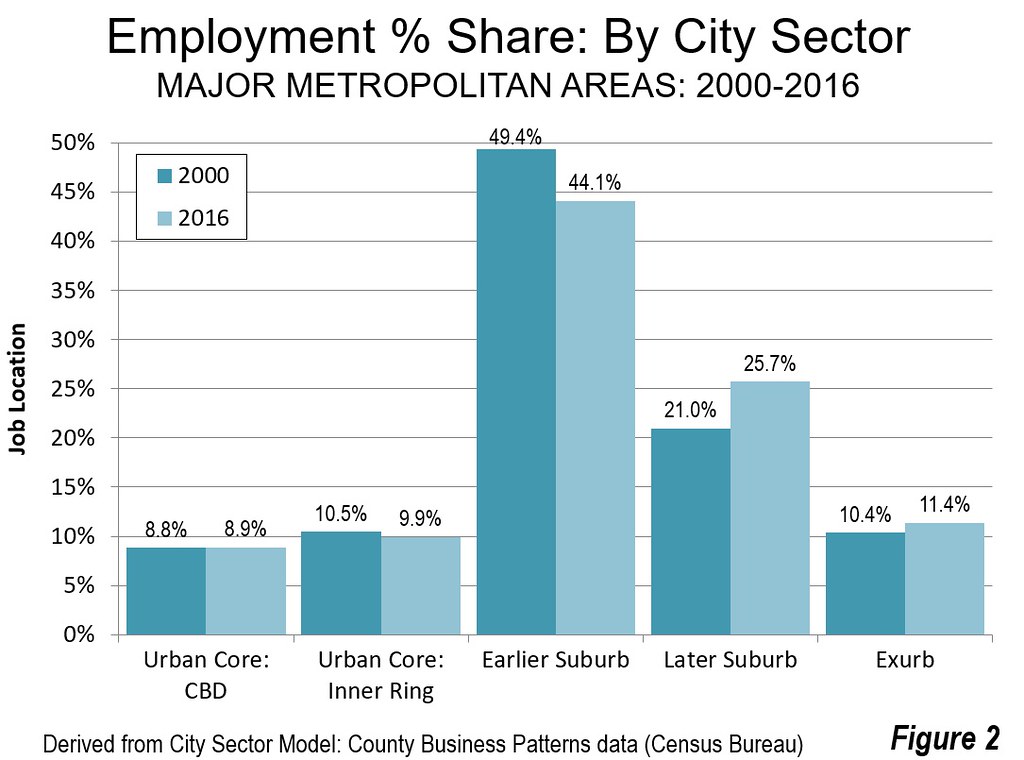
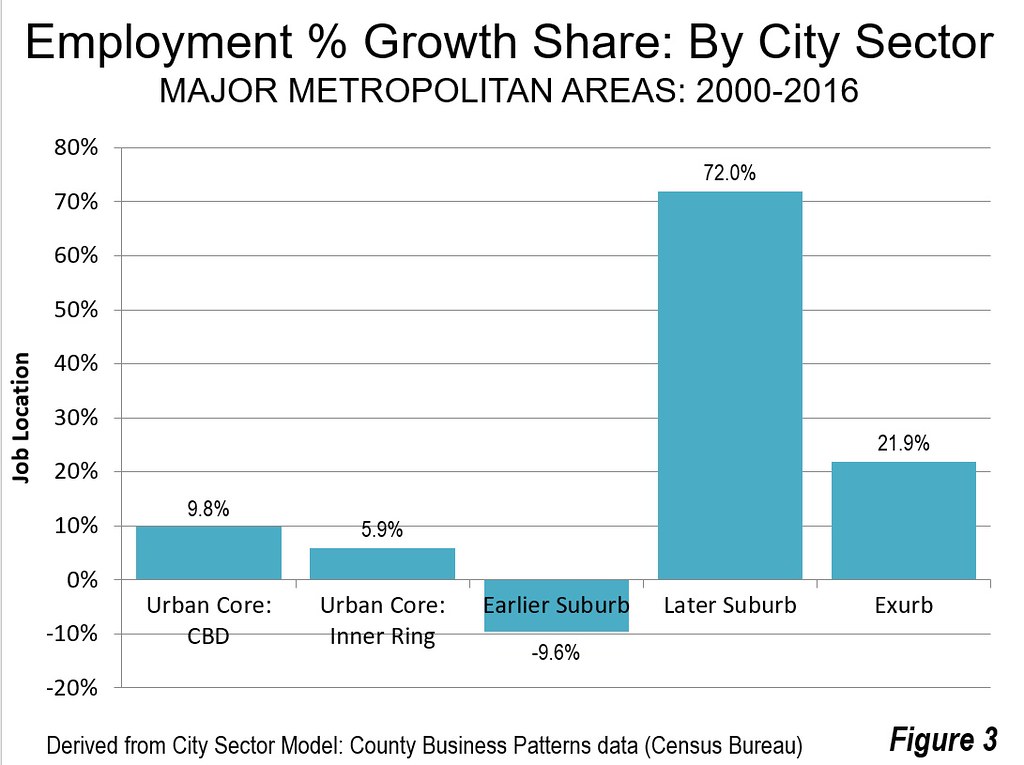
But the real momentum is beyond polycentrism, to dispersal outside of even suburban business centers. (Figure 1). Earlier, Gordon and Harry Richardson showed that Los Angeles had left polycentricity behind for a dispersed urban form by 1990. Although the Lee and Gordon research has not been updated, the most recent Census Bureau County Business Patterns data shows that 94 percent of new employment has been located in two outer sectors (Later Suburbs & Exurbs) since 2000 (Figures 2 & 3).
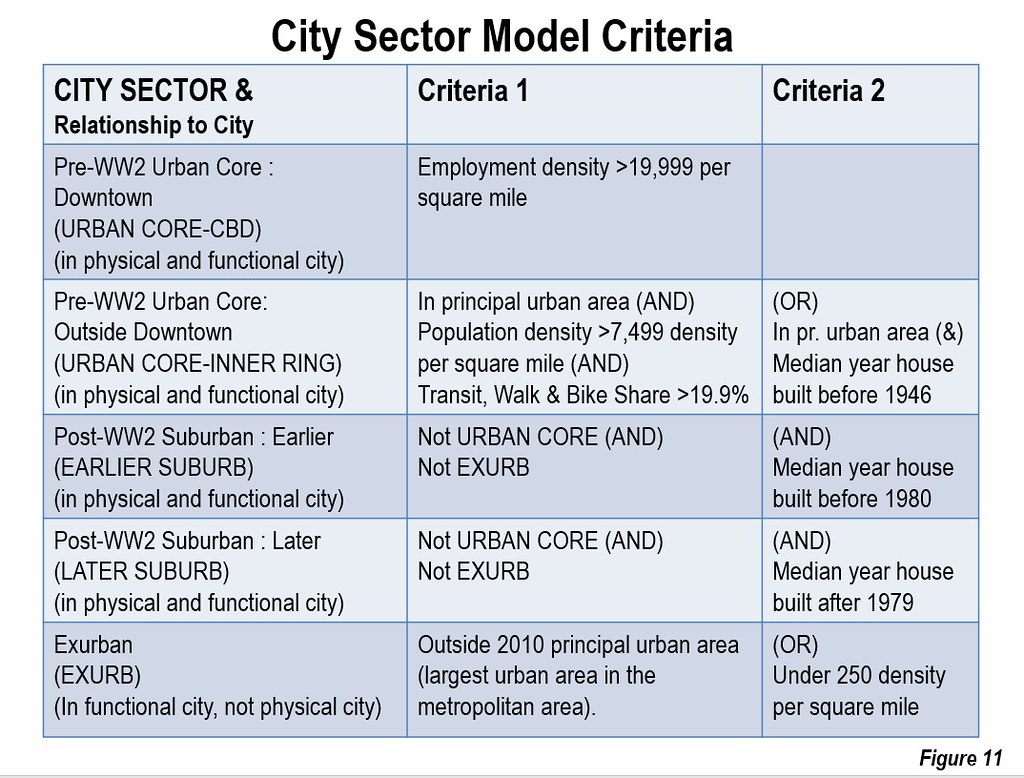
This analysis uses the City Sector Model and American Community Survey (2012-2016) to estimate average work trip travel times for 2016 for sectors within major metropolitan areas (See Note and Figure 11). This demonstrates that across the entire US metropolitan area, average one-way work trip travel times are around 30 minutes or less.
Evenly Dispersed Residences & Employment
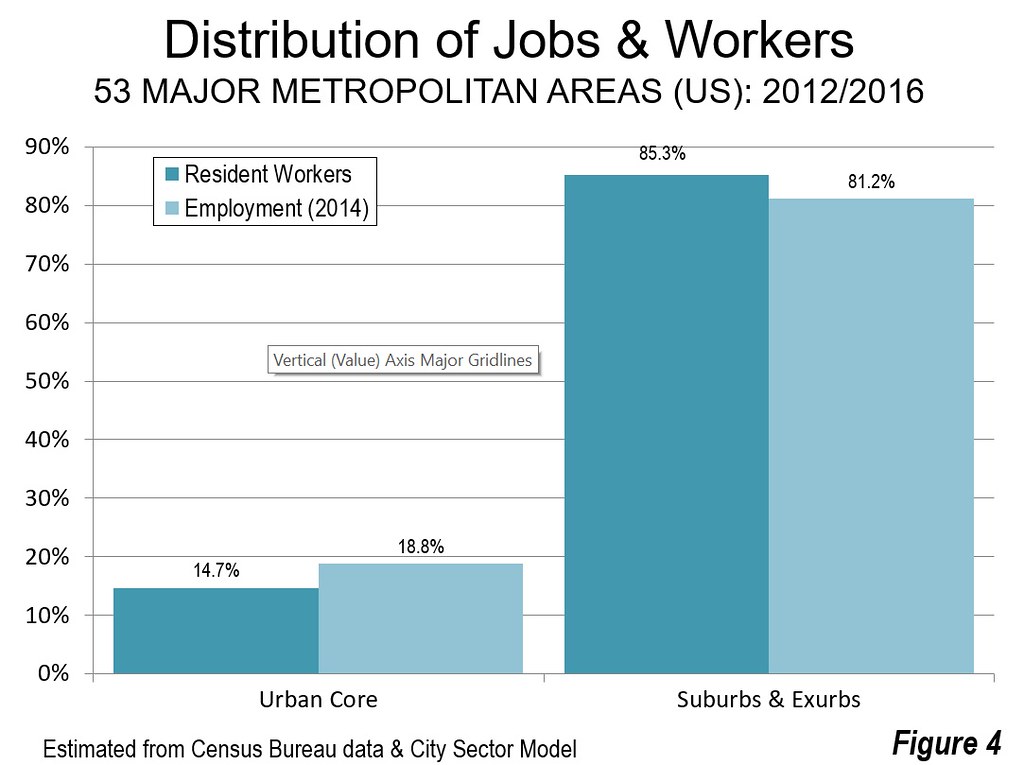
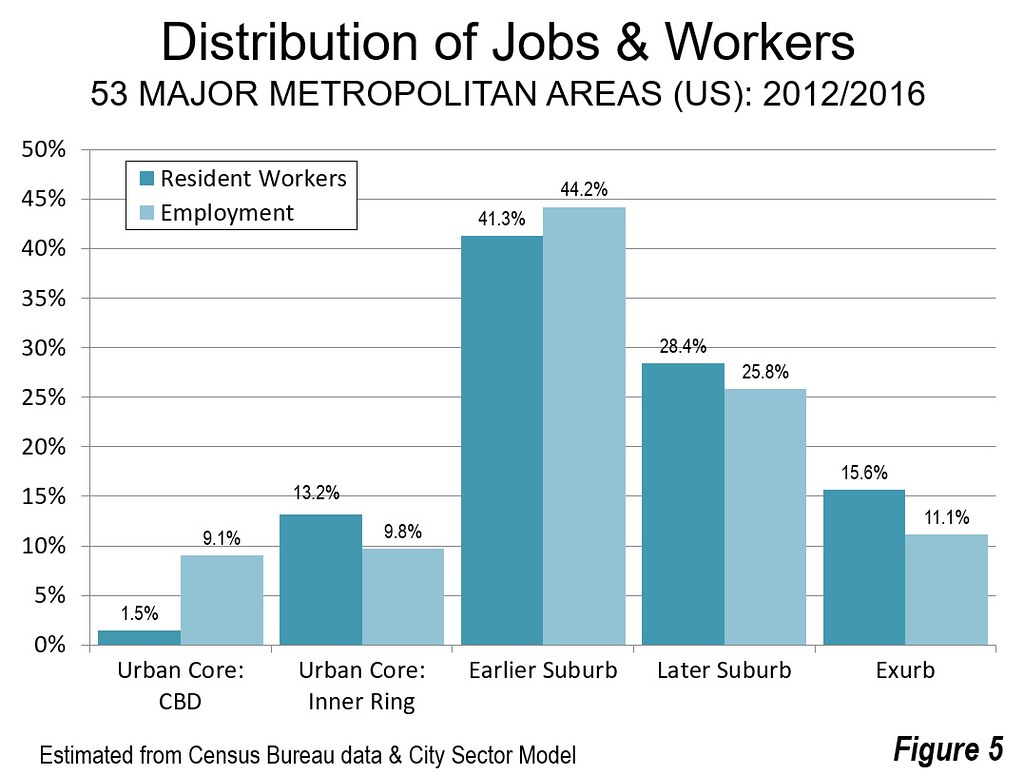
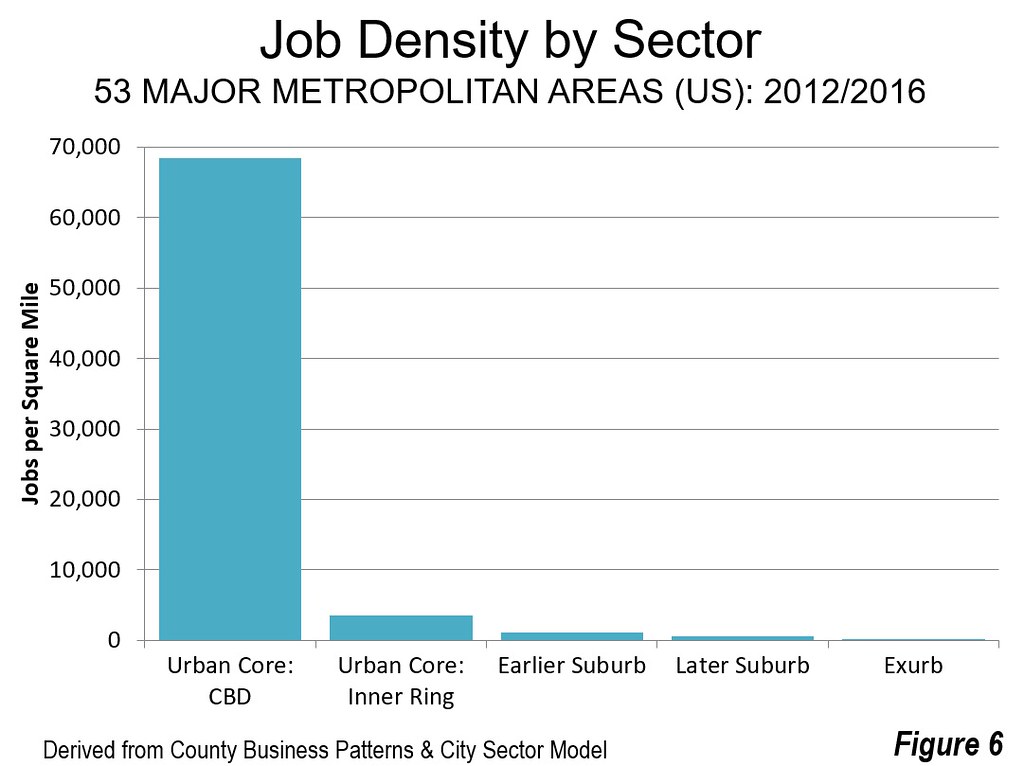
Jobs and resident workers are relatively balanced in US metropolitan areas. In the suburbs and exurbs, there are 0.95 jobs per resident worker, and 1.28 resident jobs per resident workers in the Urban Core (Figure 4). This figure, however, masks the distorted ratio in the Urban Core CBD, which has by far the highest employment density of any sector, nearly 20 times that of the second densest sector (Urban Core: Inner Ring) and 60 times that of the Earlier Suburbs, which have nearly five times as many jobs (Figure 6). Yet despite its extreme concentration of employment, the Urban Core: CBD still only represents less than 10 percent of overall employment.
Travel Times
This dispersion works to the advantage of commuters, whose travel times are remarkably similar throughout metropolitan areas.
Overall, suburban and exurban commuters have faster travel times (28.1 minutes) on average to work than those living (Figure 7) in the urban cores (32.7 minutes). The greatest disparities are in the largest metropolitan areas, such as in New York, Los Angeles, Chicago, and Philadelphia where urban core commuters travel for much longer to get to work, (Table). Nonetheless, in many other metropolitan areas, urban ore residents have quicker work trip travel time than those in the suburbs and exurbs. Overwhelmingly, these are where there is greater auto use (cars have quicker work trips, see below), together with low enough densities to limit traffic congestion.
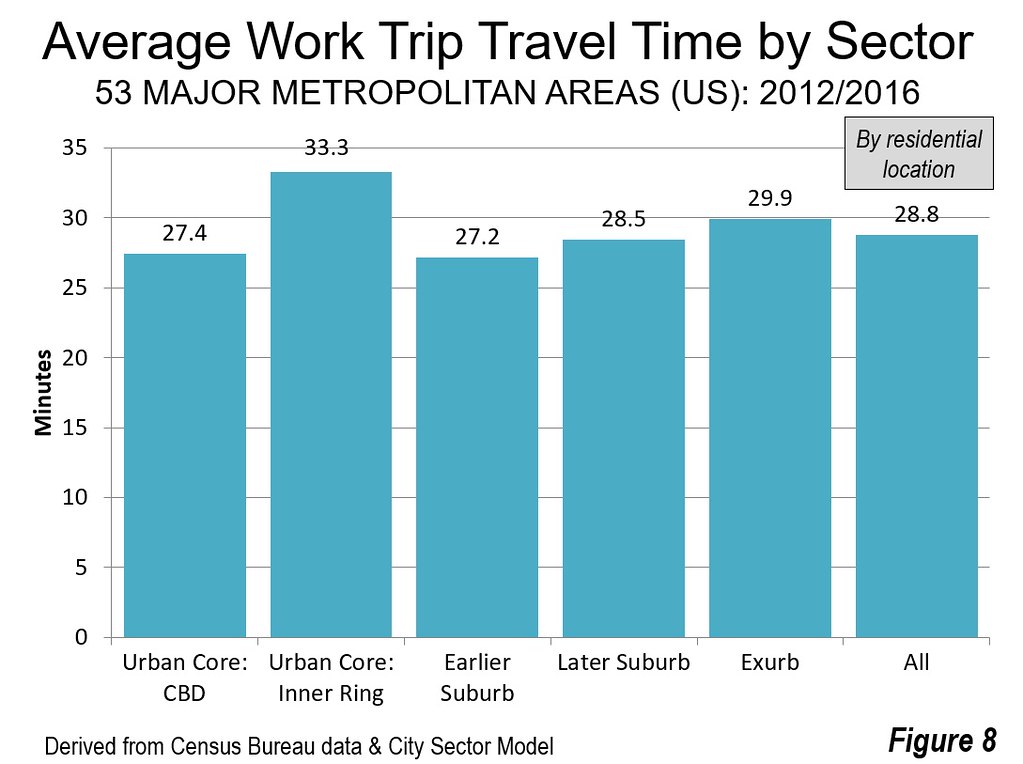
The finer grained sectoral analysis shows that workers living in the Earlier Suburbs have the shortest commutes, at 27.2 minutes. Those living in the Urban Core: CBD have the second shortest travel times, at 27.4 minutes (Figure 8). Neither of these results are surprising. The Earlier suburbs are more accessible to the rest of the city, since they are closer to the four other sectors and they have the most jobs. The shorter travel times of the Urban Core: CBD make the chances of finding suitable employment that can be reached more quickly, with six times as many jobs as workers. Obviously, this cannot be replicated throughout the metropolitan area, since by definition, labor markets have about the same number of jobs and employed workers.
The longest travel time among the five sectors is in the Urban Core: Inner Ring, at 33.3 minutes. The outer two sectors, the Later Suburbs and the Exurbs have travel times of 28.5 minutes and 29.9 minutes, close to the average of 28.8 minutes. This demonstrates the effectiveness of automobile oriented residential and employment density in keeping travel times down. It is worth noting that more dense international cities, that are the most dependent on transit, tend to suffer longer commuting times, such as Hong Kong and Tokyo.
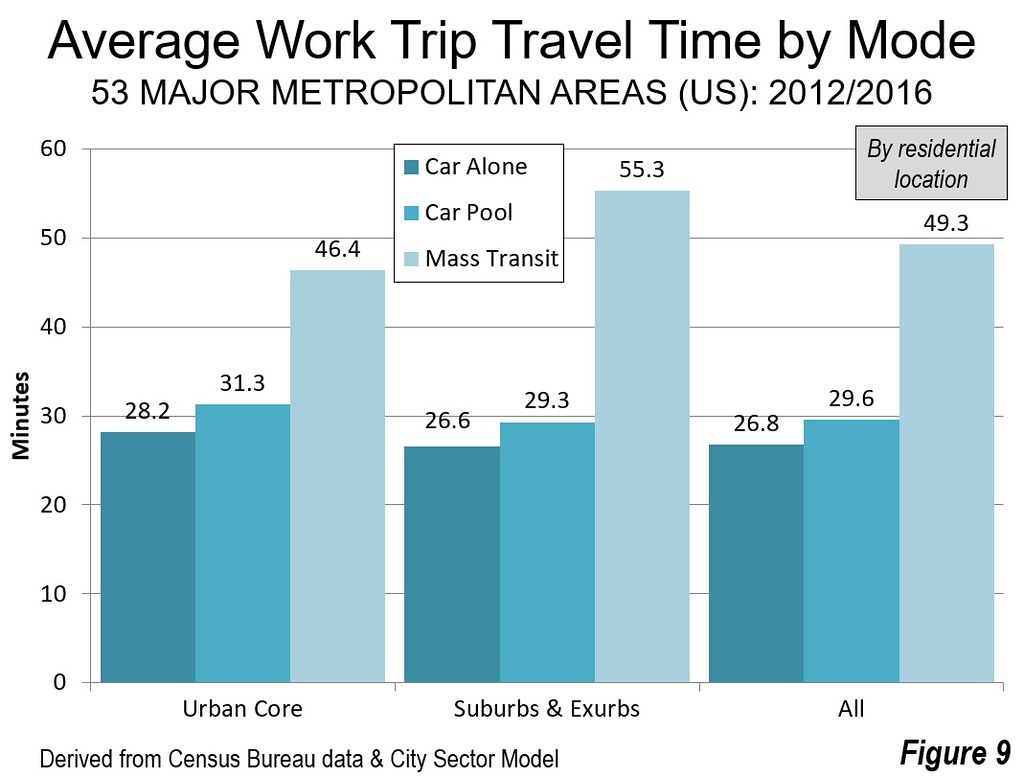
Among the largest commuting modes (excluding working at home with its commute time of zero), driving alone takes the least time, averaging 28.2 minutes for urban core residents and 26.6 minutes for suburban and exurban residents. In both cases, car pools travel about three minutes longer. Transit takes much longer, 46.4 minutes for urban core residents and 55.3 minutes for suburban and exurban residents (Figure 9). Among the five sectors, there is little difference in commuting times for those who drive along or are in car pools.
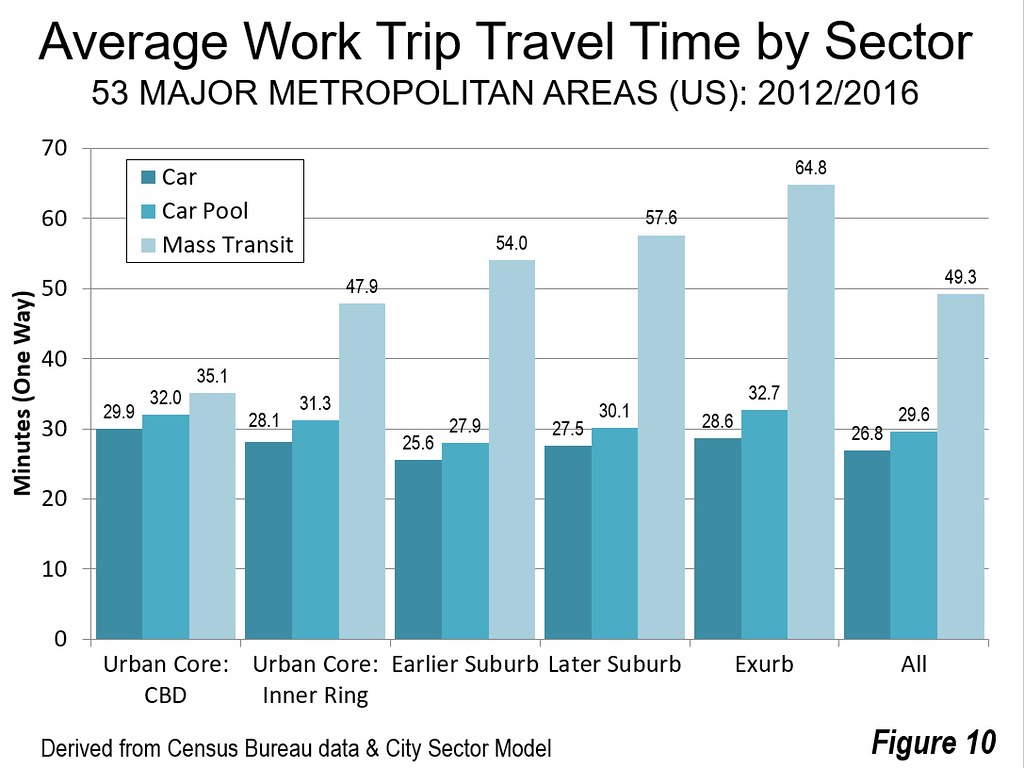
Transit travel times rise rapidly as distances increase from the CBD (Figure 10). This is to be expected, since transit systems are necessarily designed principally to serve the CBDs, where employment densities are high enough to justify frequent service, despite massive subsidies. Elsewhere in the metropolitan area, that is simply not the case, with automobiles providing access to more than 60 times as many jobs in 30 minutes as transit in the major metropolitan areas (see: “Focusing on Mobility, Not Travel Mode for Better Economic Growth”). With this kind of disparity, it is not hard to understand why automobiles dominate travel in the modern city.
Maintaining Quicker Travel Times
Yet, for decades, transit promoters have claimed that much more transit spending would reduce traffic congestion. This just has not happened. Perhaps the starkest example is Los Angeles County, which has seen driving and working at home capture 99 percent of the nearly 350,000 new daily commutes over the last decade (according to American Community Survey data), and an overall drop in transit commuting, despite a Herculean pace of new rail and busway openings. Yet, quick work trip travel times remain integral to improved economic performance. Continuing dedication and efforts to provide sufficient roadway capacity are needed to “keep the traffic moving”, perhaps with the aid of new technologies such as ride-hailing and, down the road, autonomous vehicles.
Note: The City Sector Model classifies small areas based upon their urban characteristics, with two urban core sectors (Urban Core: CBD and Urban Core: Inner Ring) having higher population densities, and greater dependence on transit, walking and cycling. The three other sectors, Earlier Suburbs, Later Suburbs and Exurbs are more automobile oriented and tend to have the suburban forms that have dominated development since World War II. City Sector Model analysis provides results that are far more accurate in measuring urban cores versus suburban and exurban development than using municipal boundaries, since the most of the core municipalities have the majority of their population in areas with suburban and exurban characteristics and none is 100 percent urban core. For example, even in the city of New York, much of Staten Island is at least as suburban as the adjacent New Jersey suburbs).
Photograph: Los Angeles Urban Area Freeway (densest large urban area in the United States), by author


| AVERAGE WORK TRIIP TRAVEL TIMES: 2016 | |||
| US Major Metropolitan Areas | |||
| Major Metropolitan Area | Urban Core | Suburbs & Exurbs | Entire MSA |
| Atlanta, GA | 21.8 | 31.0 | 31.0 |
| Austin, TX | 17.1 | 26.6 | 26.4 |
| Baltimore, MD | 29.8 | 30.6 | 30.5 |
| Birmingham, AL | 26.0 | 26.0 | |
| Boston, MA-NH | 29.8 | 31.1 | 30.6 |
| Buffalo, NY | 20.4 | 21.6 | 21.3 |
| Charlotte, NC-SC | 26.3 | 26.3 | |
| Chicago, IL-IN-WI | 33.5 | 30.6 | 31.3 |
| Cincinnati, OH-KY-IN | 20.9 | 25.0 | 24.6 |
| Cleveland, OH | 24.0 | 24.8 | 24.6 |
| Columbus, OH | 19.0 | 23.7 | 23.5 |
| Dallas-Fort Worth, TX | 23.1 | 27.8 | 27.8 |
| Denver, CO | 22.9 | 27.5 | 27.3 |
| Detroit, MI | 26.4 | 26.7 | 26.7 |
| Grand Rapids, MI | 19.9 | 22.0 | 21.9 |
| Hartford, CT | 22.1 | 24.0 | 23.8 |
| Houston, TX | 19.9 | 29.5 | 29.4 |
| Indianapolis. IN | 22.6 | 24.9 | 24.8 |
| Jacksonville, FL | 26.3 | 26.3 | |
| Kansas City, MO-KS | 19.9 | 23.1 | 22.9 |
| Las Vegas, NV | 26.3 | 24.3 | 24.4 |
| Los Angeles, CA | 31.0 | 29.5 | 29.6 |
| Louisville, KY-IN | 21.6 | 23.9 | 23.7 |
| Memphis, TN-MS-AR | 19.5 | 24.1 | 24.0 |
| Miami, FL | 26.6 | 28.6 | 28.5 |
| Milwaukee,WI | 21.9 | 23.5 | 23.2 |
| Minneapolis-St. Paul, MN-WI | 22.5 | 25.6 | 25.2 |
| Nashville, TN | 14.6 | 27.1 | 27.1 |
| New Orleans. LA | 20.5 | 26.4 | 25.7 |
| New York, NY-NJ-PA | 38.9 | 32.6 | 35.9 |
| Oklahoma City, OK | 16.4 | 22.6 | 22.4 |
| Orlando, FL | 27.9 | 27.9 | |
| Philadelphia, PA-NJ-DE-MD | 32.2 | 28.3 | 29.2 |
| Phoenix, AZ | 26.0 | 26.0 | |
| Pittsburgh, PA | 24.7 | 26.9 | 26.5 |
| Portland, OR-WA | 24.0 | 26.4 | 26.1 |
| Providence, RI-MA | 23.4 | 26.3 | 25.6 |
| Raleigh, NC | 25.3 | 25.3 | |
| Richmond, VA | 19.2 | 25.4 | 25.1 |
| Riverside-San Bernardino, CA | 31.8 | 31.8 | |
| Rochester, NY | 19.7 | 21.4 | 21.2 |
| Sacramento, CA | 21.8 | 26.4 | 26.3 |
| St. Louis,, MO-IL | 23.1 | 25.8 | 25.5 |
| Salt Lake City, UT | 18.8 | 22.7 | 22.5 |
| San Antonio, TX | 17.1 | 25.7 | 25.6 |
| San Diego, CA | 22.3 | 25.4 | 25.3 |
| San Francisco-Oakland, CA | 31.7 | 32.4 | 32.2 |
| San Jose, CA | 21.1 | 27.3 | 27.3 |
| Seattle, WA | 25.4 | 30.2 | 29.6 |
| Tampa-St. Petersburg, FL | 26.7 | 26.7 | |
| Tucson, AZ | 24.3 | 24.3 | |
| Virginia Beach-Norfolk, VA-NC | 18.9 | 24.2 | 24.1 |
| Washington, DC-VA-MD-WV | 30.6 | 35.3 | 34.4 |
| TOTAL | 32.7 | 28.1 | 28.8 |
| Derived from American Community Survey, 2016. | |||
Wendell Cox is principal of Demographia, an international public policy and demographics firm. He is a Senior Fellow of the Center for Opportunity Urbanism (US), Senior Fellow for Housing Affordability and Municipal Policy for the Frontier Centre for Public Policy (Canada), and a member of the Board of Advisors of the Center for Demographics and Policy at Chapman University (California). He is co-author of the "Demographia International Housing Affordability Survey" and author of "Demographia World Urban Areas" and "War on the Dream: How Anti-Sprawl Policy Threatens the Quality of Life." He was appointed to three terms on the Los Angeles County Transportation Commission, where he served with the leading city and county leadership as the only non-elected member. He served as a visiting professor at the Conservatoire National des Arts et Metiers, a national university in Paris.


