
Much of the US population of the United States is located in its major metropolitan areas, those with more than one million population. In 2017, the 53 major metropolitan areas had 56% of the population, and they attracted two-thirds of the population growth from 2000 (present geographical delineation). Economic research, such as by Remy Prud'homme and Chang-Woon Lee at the University of Paris as well as David Hartgen and M. Gregory Fields at the University of North Carolina, Charlotte suggests that the economic growth of metropolitan areas is enhanced by access --- the greater the number of jobs that the average worker can reach in a particular time, the better the economic performance.
Recent advances in data have made it possible to measure the effectiveness of access systems in metropolitan areas. The University of Minnesota’s Accessibility Laboratory has been a leader in developing metropolitan access measures and has recently published access metrics for autos and transit (Note 1). Data is provided for the 50 largest metropolitan areas for autos, with Memphis excluded for transit. The auto and automobile access data is based on morning peak periods.
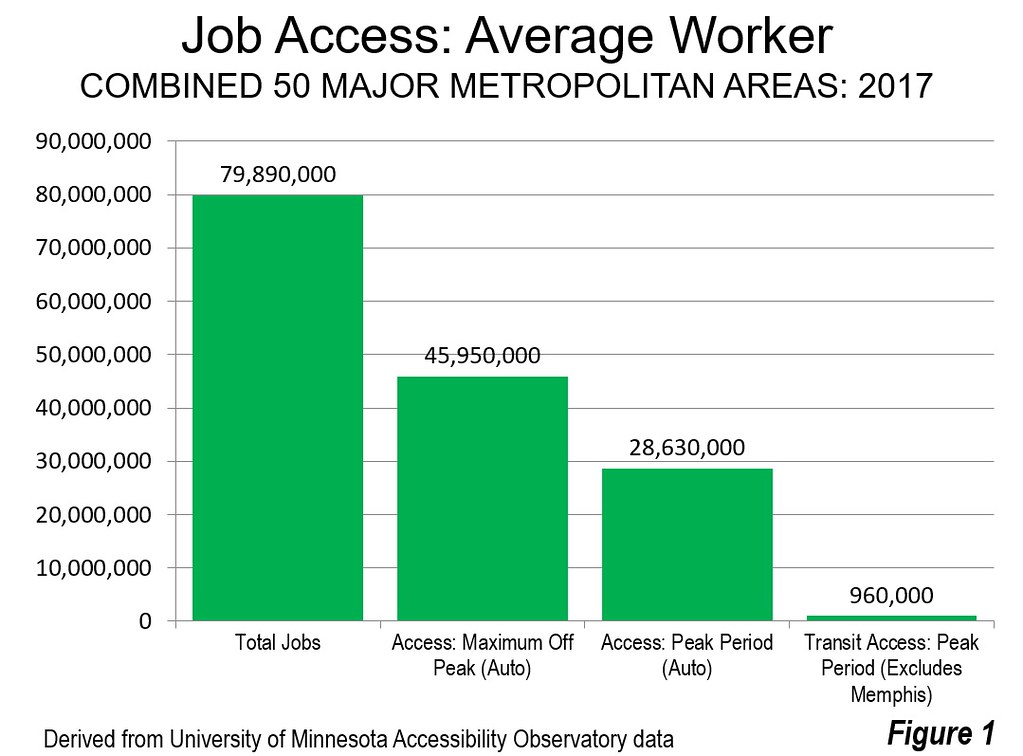
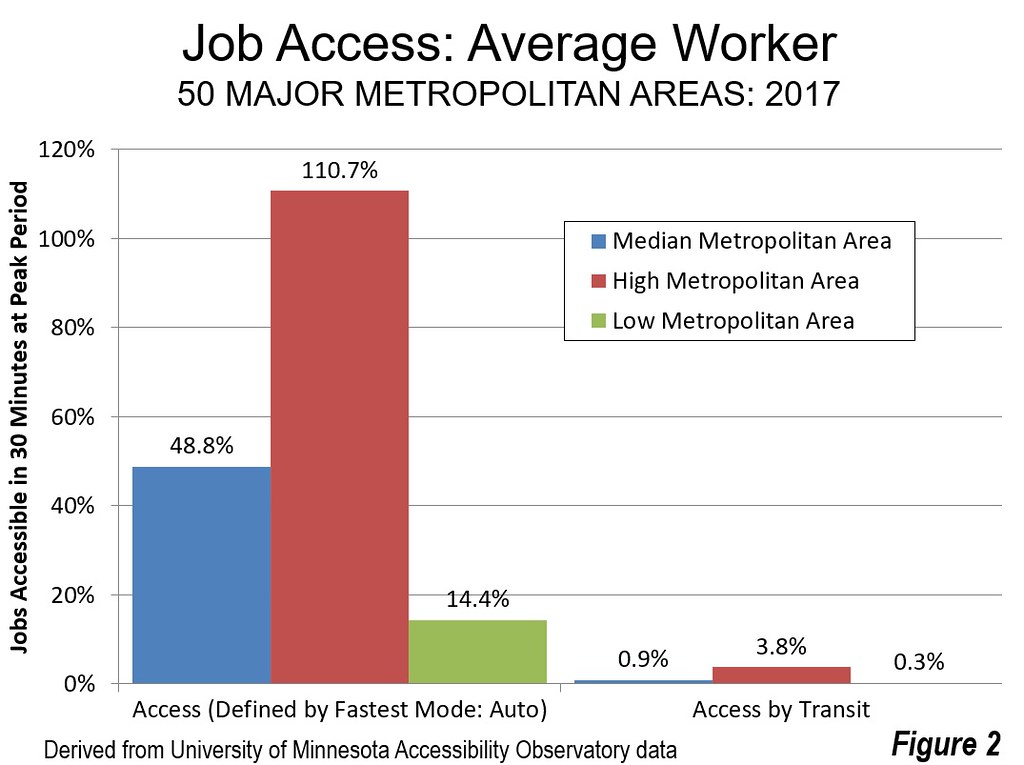
As Figure 1 and 2 indicate, automobiles provided by far the greatest job access in every major metropolitan area. As a result, automobile access defines access in metropolitan areas. The average one-way work trip travel time in the United States is between 25 and 30 minutes. Nearly 62% of all work trips are less than 30 minutes. This article uses the University of Minnesota 30-minute access data as a standard for rating job access in the major metropolitan areas.
Metropolitan Areas with the Greatest Job Access
Overall, a median of 48.8% of jobs can be accessed within 30 minutes by the average employee in the 50 metropolitan areas surveyed by the Accessibility Observatory. Salt Lake City has the greatest access in relation to its metropolitan area jobs, at 110.7%, a number that exceeds 100% because additional jobs are accessible in adjacent metropolitan areas (see below). San Jose has the second most access, at 89.3%. Las Vegas ranks third, with 87.2 of its jobs accessible. Raleigh and Hartford round out the top five, at above 80% (Figure 3).
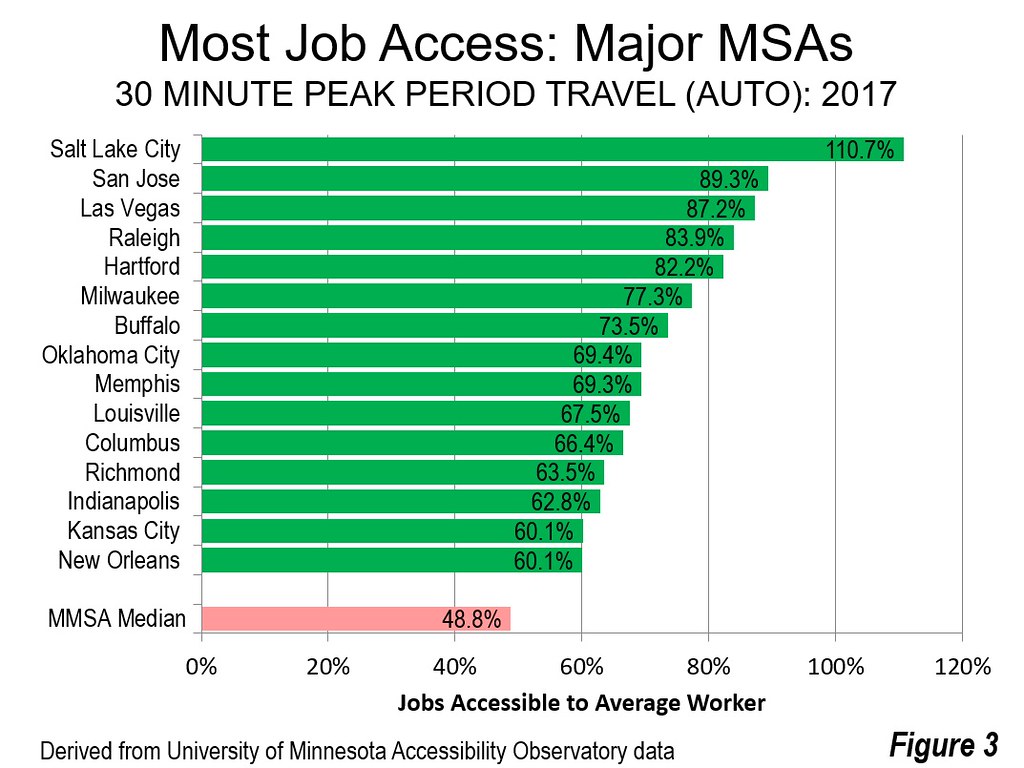
Caution on the Ratings: However, this is not necessarily a reflection that these metropolitan areas have the most efficient road systems. For example, adjacent metropolitan areas increase the jobs accessible to the residents of Salt Lake City, San Jose and Raleigh. The problem is that the “building blocks” (counties) used by the US Office of Management and Budget to delineate metropolitan areas are far too large to reflect actual labor markets, as indicated in commuting patterns. This is most evident in Salt Lake City, where the boundary of the Ogden metropolitan area is little more than five miles from Temple Square (downtown). The Provo metropolitan area boundary is less than 25 miles away, an easy commute. The use of census tracts as metropolitan area building blocks would result in more credible metropolitan area (labor market) boundaries (Note 2). Despite this technical point, residents are able to reach additional nearby jobs.
Metropolitan Areas with the Least Job Access
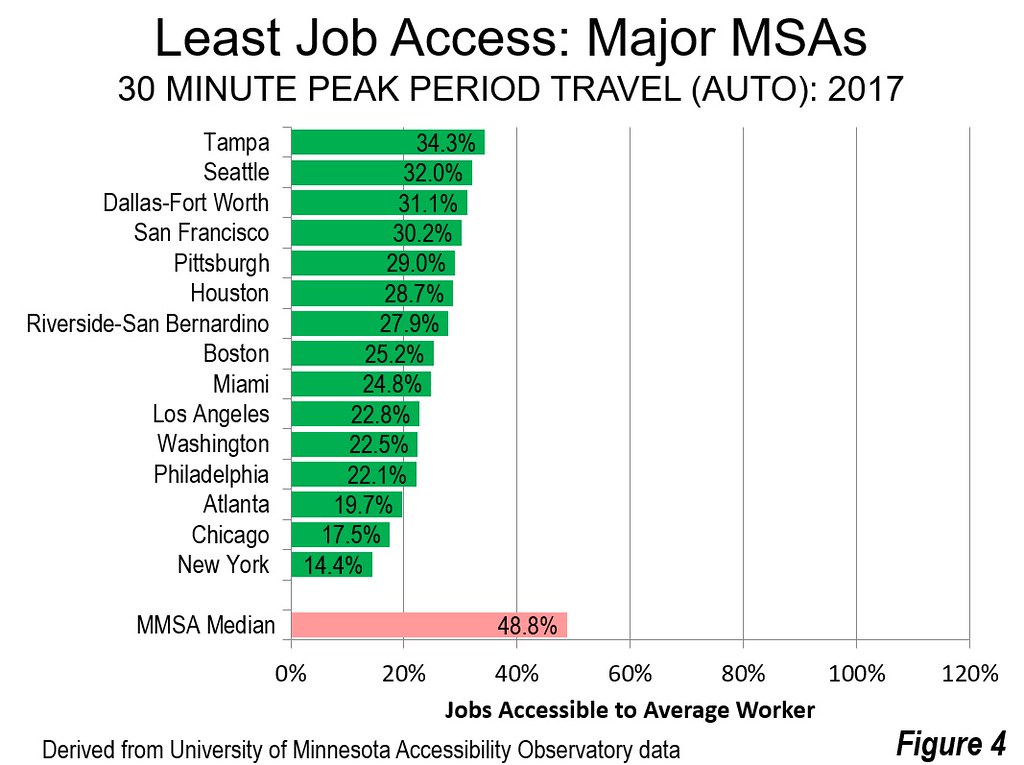
New York has the least job access within 30 minutes, at 14.4%. This is not surprising, since New York covers more land area than any other urban area in the world (Figure 4). Even so, New York’s superior roadway system permits considerably faster average work trip travel times than other high-income world metropolitan areas with larger populations and higher urban densities, Tokyo-Yokohama and Seoul.
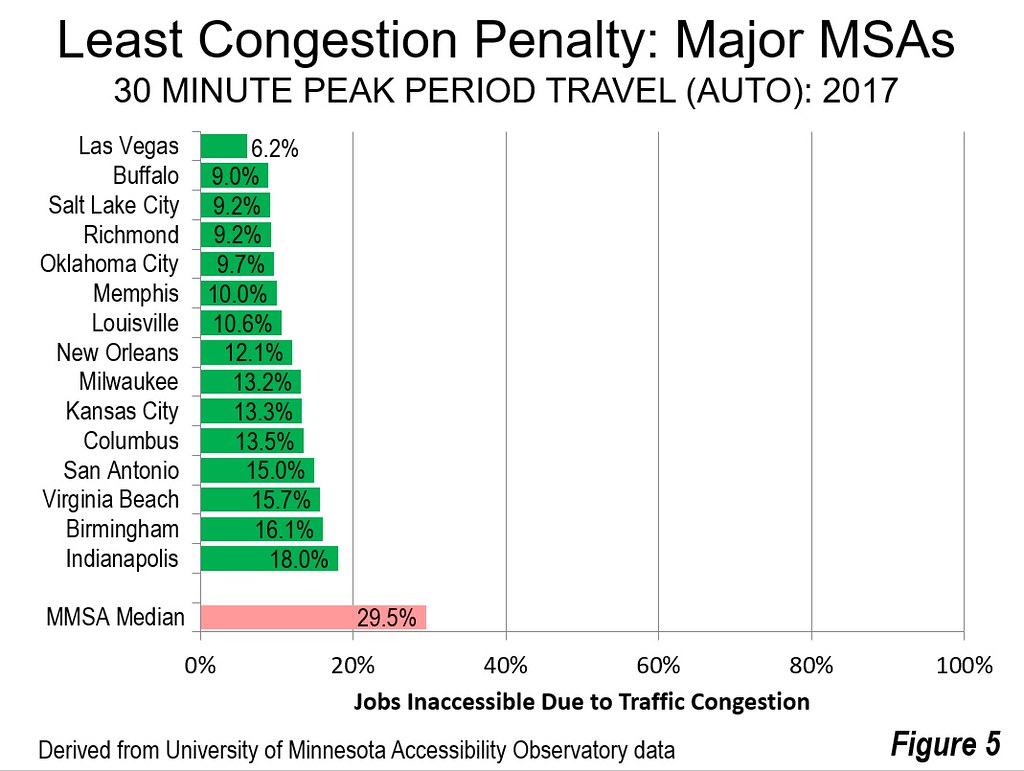
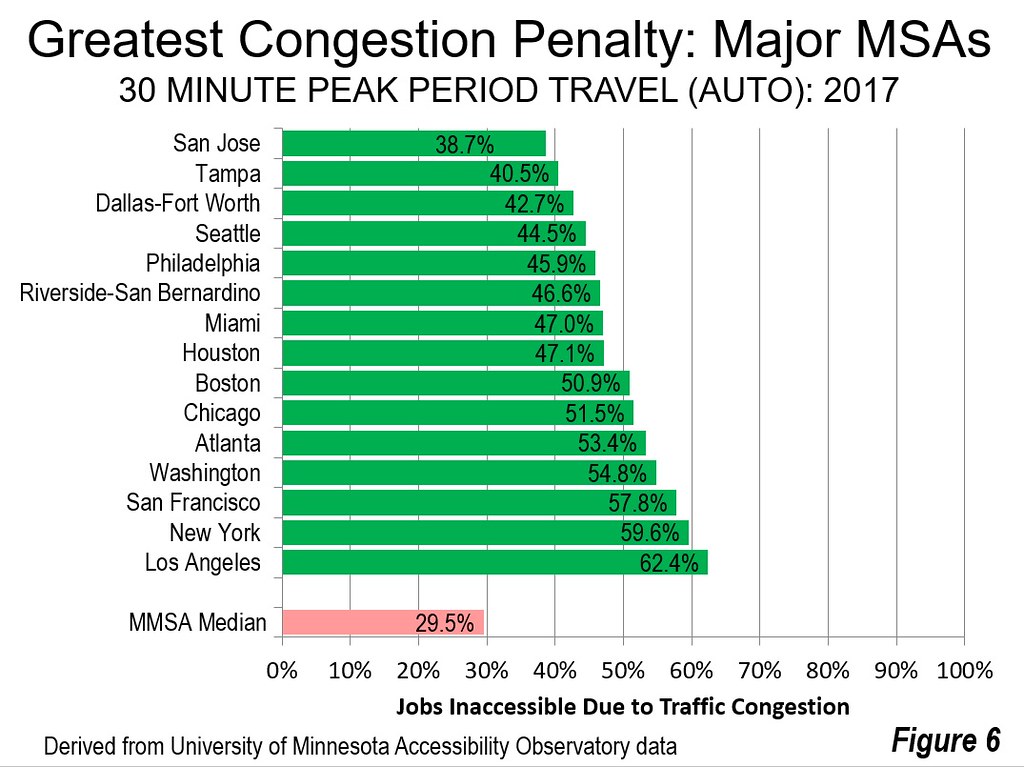
The Impact of Traffic Congestion
The Observatory Laboratory also estimates the extent to which traffic congestion reduces job access. The number of jobs that cannot be reached due to traffic congestion are expressed in percentages, which this article refers to as the “Congestion Penalty” (Figures 5 & 6).
Transit Access
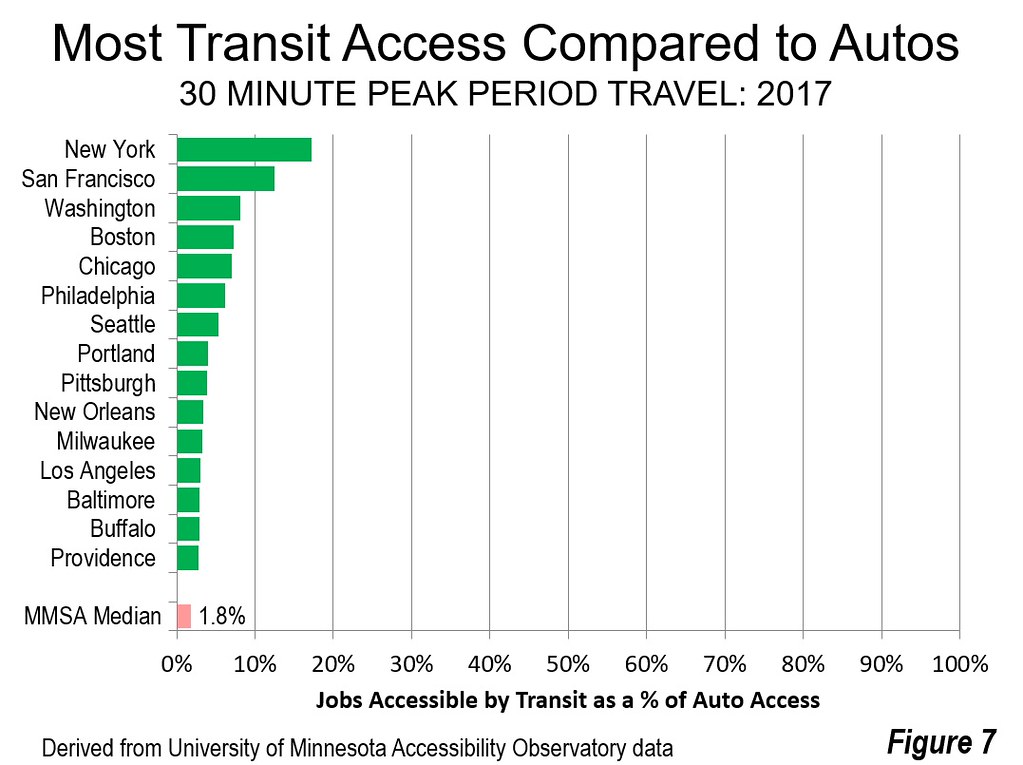
Transit access is considerably less than that of cars. In the median major metropolitan area, the average worker can access 0.9% of the jobs within 30 minutes. This is 1.8% of the jobs that can be reached by car. Autos provide 55.7 times as much access to jobs for the average employee.
For example, in New York, with by far the nation’s most comprehensive transit system, the average worker can get to 17% as many jobs by transit as by car (Figure 7). This means that the average worker can reach almost 6 times as many jobs (600%) by car as by transit. San Francisco has the second most competitive transit system, reaching 12% as many jobs as the car. Washington, Boston, Chicago, Philadelphia and Seattle have transit systems that access between 5% and 10% of the jobs that can be reached by car.
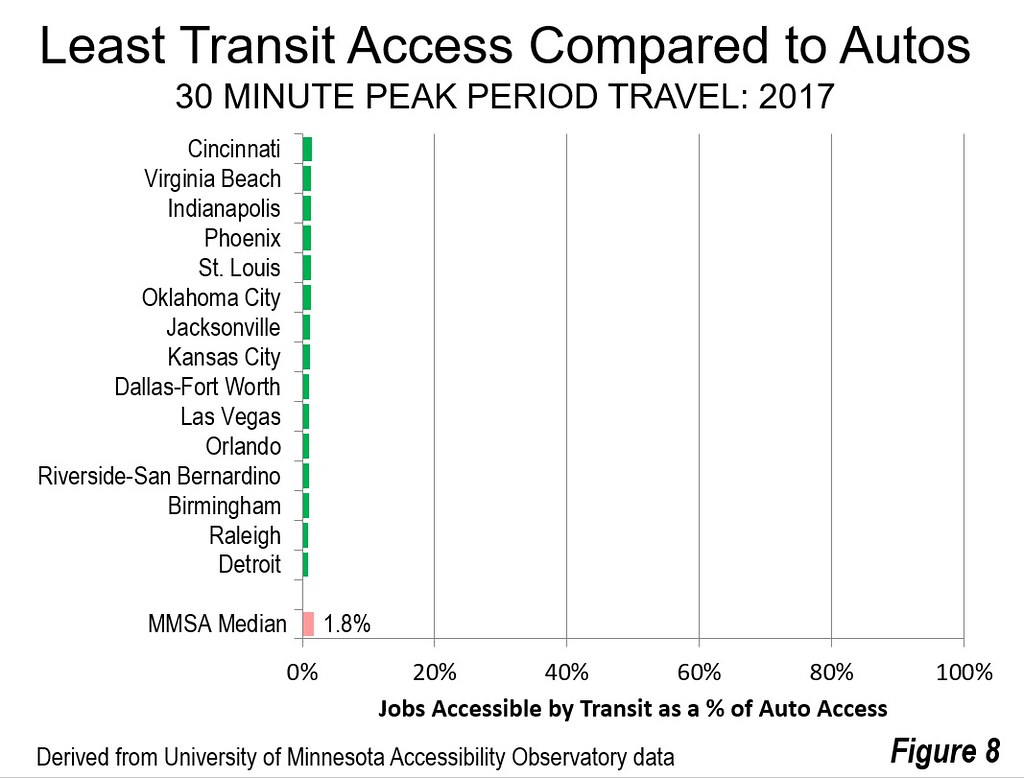
At the other end of the scale, Detroit and Raleigh have the least competitive transit, which provides access to less than one percent of the jobs accessible by car (Figure 8). In Detroit, 124 times as many jobs can be reached by car as by transit, and 112 times as many in Raleigh.
These figures are astonishing, in view of the many billions that have been spent to develop urban rail systems to attract people from cars. They have not removed even a pittance from automobile volumes.
Transit is About Downtown: In fact, the impact of transit as a substitute for automobile use is limited to the largest central business districts. Transit’s six legacy cities, the municipalities of New York, Chicago, Philadelphia, San Francisco, Boston and Washington account for 57.5% of all transit commuting destinations in the nation. And, transit commuting is becoming even more concentrated, as 81% of the increase in transit commuting in the last decade has been to destinations in these six municipalities. Most of this commuting is to the six largest downtown areas (central business districts) in the nation, which are located in these municipalities.
Improving Public Investment Decisions
For decades transit planning agencies and public officials (including when I served on the Los Angeles County Transportation Commission) have claimed that new transit rail systems can materially reduce traffic congestion. The development of access metrics should put an end to such misconceptions (Note 3).
Regional planning agencies, transportation agencies and public officials should use the access metrics to direct funding to strategies that improve 30 minute access throughout cities. That principally means attention to improving the highway system. It’s time to develop a metric for urban transportation investments to address the fundamental goal of improving access, specifically the cost per new percentage point of job access. Getting people more access is critical to strong economies and reducing poverty, and deserves an assessment based on facts, not wishful thinking or mythology.
---
Note 1: The University of Minnesota Accessibility Observatory has also produced metrics for walking, though not this year. Not surprisingly, walking provides little access to metropolitan area jobs. The previous report put walking access at about one-third of transit nationally, a negligible number of jobs compared to autos. However, walking can be important in niche markets such as neighborhoods that have hyper densities of both residences and jobs (such as Manhattan and Chicago’s River North).
Note 2: The Office of Management and Budget also delineates “combined statistical areas” (CSAs) which are larger labor markets. Salt Lake City, Ogden and Provo share a CSA. San Jose is combined with adjacent San Francisco and nearby Napa, Santa Cruz, Santa Rosa, Stockton and Vallejo. Raleigh is combined with Durham. Perhaps it would be preferable for access metrics to be based on CSA’s rather than metropolitan areas. However, counties would still be far too large as building blocks.
Note 3: It has become increasingly obvious that new urban rail systems have little impact on traffic congestion since they were introduced in the 1980s. This is principally because they do not attract drivers from cars. This concern led me to suggest development of access indicators, for both workers and employers based on a 30 minute travel time in a working paper for the Texas Governor’s Business Council and in the subsequent final report, Shaping the Competitive Advantage of Texas Metropolitan Regions.
Wendell Cox is principal of Demographia, an international public policy and demographics firm. He is a Senior Fellow of the Center for Opportunity Urbanism (US), Senior Fellow for Housing Affordability and Municipal Policy for the Frontier Centre for Public Policy (Canada), and a member of the Board of Advisors of the Center for Demographics and Policy at Chapman University (California). He is co-author of the "Demographia International Housing Affordability Survey" and author of "Demographia World Urban Areas" and "War on the Dream: How Anti-Sprawl Policy Threatens the Quality of Life." He was appointed to three terms on the Los Angeles County Transportation Commission, where he served with the leading city and county leadership as the only non-elected member. He served as a visiting professor at the Conservatoire National des Arts et Metiers, a national university in Paris.
Photograph: Interstate 110 Los Angeles (by author)


