
There was big news in the 2018 population estimates just released on metropolitan areas in the United States. For the first time all three of the largest metropolitan areas lost population. This unprecedented development includes New York, Los Angeles and Chicago. All of the other 12 top metropolitan areas in the nation increased their population, including Detroit, which has lost population in many years.
Dallas-Fort Worth was the biggest gainer, adding 132,000 residents over the past year, to rise above 7.5 million for the first time. Phoenix and Houston gained between 90,000 and 100,000 residents, while Atlanta gained 76,000 (Figure 1). Detailed data is for all of the 106 metropolitan areas with more than 500,000 population is at the bottom of this article.

Proportional Population Gains
In percentage terms, the strongest major metropolitan areas (the 53 with more than 1,000,000 population) the biggest population gains were Austin, Orlando, Las Vegas, Raleigh and Phoenix (Figure 2). All five exceeded an annual increase of two percent. The largest losing areas in percentage terms were Pittsburgh, New York, Chicago, Cleveland and Los Angeles (Figure 2).

Among the 53 middle-sized metropolitan areas (500,000 to 1,000,000), Lakeland (FL), Boise (ID) and Provo (UT) led the percentage gainers. Honolulu and Youngstown (OH-PA) experienced the greatest percentage losses, at 0.5 percent or more (Figure 3). Overall, there are nearly 400 metropolitan areas, most of which are smaller than the major and middle-sized metropolitan areas.

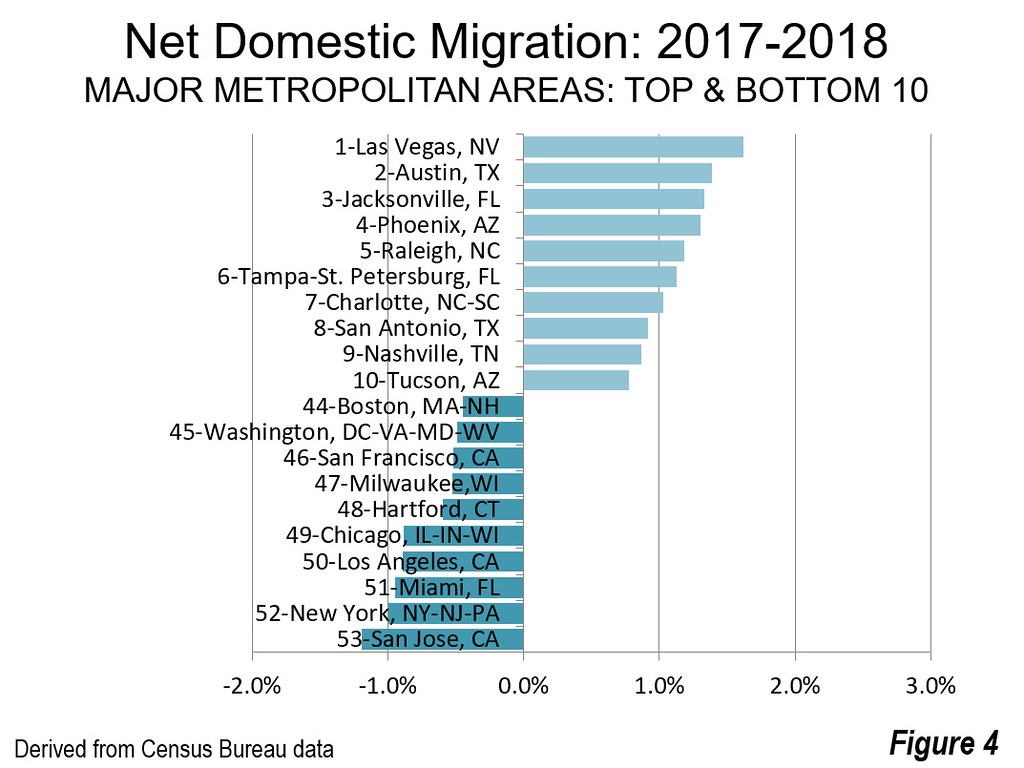
Proportional Net Domestic Migration
The strongest net domestic migration percentage gains among the major metropolitan areas were in Las Vegas, Austin, Jacksonville, Phoenix, Tampa-St. Petersburg and Charlotte, all exceeding a rate of one percent compared to 2017. San Jose, New York, Miami, Los Angeles and Chicago had the largest net domestic migration percentage losses, all exceeding a rate of minus 0.8 percent (Figure 4).
Among the middle-sized metropolitan areas, Lakeland, Boise and Sarasota (FL) had the largest percentage gains, all over 2 percent of their 2018 population. The largest net domestic migration percentage losses were in Honolulu, El Paso, Bridgeport-Stamford (CT), Jackson (MS) and New Haven (CT), all exceeding minus 0.5 percent (Figure 5).

Domestic Migration by Metropolitan Area Population
The middle-sized metropolitan areas again substantially outperformed the major metropolitan areas in net domestic migration, gaining nearly 100,000. By contrast, the major metropolitan areas lost over 200,000 net domestic migrants. As Figure 6 indicates, the middle-sized metropolitan areas have been generally expanding the net domestic migration gap with the larger metropolitan area cousins in recent years.
The largest major metropolitan areas sustained substantial net domestic migration losses, with the megacities (New York and Los Angeles) losing more than 318,000, and the seven metropolitan areas with from 5,000,000 to 10,000,000 population losing 122,000. This category, however, included strong gainers Dallas-Fort Worth and Atlanta, whose gains were more than offset by metropolitan areas with surprising losses, such as Miami, Washington and Boston (Figure 7). Gains were registered in each of the smaller population categories.


The middle-sized metropolitan areas had the largest net domestic migration gain, at 0.26 percent of their 2017 population, slightly more than the 0.25 percent among the 1,000,000 to 2,500,000 million category, and the 0.20 percent in the 2,500,000 to 5,000,000 category. The net domestic migration rate turns into minus 0.25 percent in the 5,000,000 to 10,000,000 category. The megacities, New York and Los Angeles (over 10 million) hemorrhaged net domestic migrants at by far the highest rate, minus 0.95 percent (Figure 8).

Net Domestic Migration: Suburbs v. Core Counties
One of the enduring myths in recent years has been that urban core (Note 1) domestic migration exceeded that of the suburbs during or after the Great Recession. Figure 9 shows this to be untrue (as was also the case in the late 2000s). However urban cores certainly performed better than before during those difficult times.

Figure 9 shows that the suburbs have done far better than the core counties in more recent years. In fact, for the last two years, suburban net domestic migration minus that of the core counties has exceeded 700,000, as is indicated in Figure 10 (Note).

Future Trends?
Much of what has been observed in recent years continues. People continue to migrate to the South and the Southwest, but not into California.
But the most recent data may portend even more important changes. It would have been inconceivable 10 years ago that Los Angeles, which was long, by some accounts, second only to Tokyo in population growth, to sustain a population loss. Chicago’s four years of losses are at odds with its modest growth that had been the rule for decades. New York, which now the Census Bureau estimates has lost population for the last two years, suffered had a large population loss in the 1970s, but had gains after that and as late as 2011 added more than 125,000 residents. Whether these losses will continue is, of course, unknown.
Finally, the growing net domestic migration trends in the middle-sized metropolitan trends could provide some strongly needed impetus to economies that have experience challenging times.
In sum, the new numbers show what has become the dominant trend of this decade: a shift to metropolitan areas that mainly have post-War suburbs, are affordable and and have lower costs. It’s time for city leaders to stop pretending there’s still a massive “return to the cities” and start addressing the reasons why so many of their residents are choosing to leave.
Note 1: The core county contains the city hall of the historical core municipality. There is one core county per metropolitan area, except in New York, where all five boroughs (counties) are classified as core counties. Counties are the lowest level of geography for which the Census Bureau estimates provide net domestic migration data.
Note 2: There were changes to the Census Bureau’s methodology, which are explained in this document. Previous year’s data can vary from amounts reported in earlier estimates. For example, the New York population loss was not reported in the 2017 release, but the data has been revised to show a 2017 loss in the 2018 release.
| Metropolitan Areas Over 500,000: Population Estimates: 2018 | ||||||||
| Corrected from original | ||||||||
| Population (000s) | 2017-2018 Change | |||||||
| Rank | Metropolitan Area | 2010 | 2017 | 2018 | Population | Rank | Net Domestic Migration | Rank |
| 1 | New York, NY-NJ-PA | 19.567 | 19.999 | 19.979 | -0.10% | 100 | -0.99% | 104 |
| 2 | Los Angeles, CA | 12.829 | 13.299 | 13.291 | -0.05% | 97 | -0.89% | 101 |
| 3 | Chicago, IL-IN-WI | 9.461 | 9.521 | 9.499 | -0.23% | 102 | -0.88% | 100 |
| 4 | Dallas-Fort Worth, TX | 6.426 | 7.408 | 7.540 | 1.78% | 14 | 0.63% | 28 |
| 5 | Houston, TX | 5.920 | 6.906 | 6.997 | 1.33% | 30 | -0.13% | 65 |
| 6 | Washington, DC-VA-MD-WV | 5.636 | 6.200 | 6.250 | 0.81% | 51 | -0.49% | 93 |
| 7 | Miami, FL | 5.565 | 6.150 | 6.199 | 0.80% | 52 | -0.95% | 102 |
| 8 | Philadelphia, PA-NJ-DE-MD | 5.965 | 6.078 | 6.096 | 0.29% | 73 | -0.20% | 73 |
| 9 | Atlanta, GA | 5.287 | 5.874 | 5.950 | 1.29% | 31 | 0.44% | 38 |
| 10 | Boston, MA-NH | 4.552 | 4.845 | 4.875 | 0.64% | 58 | -0.45% | 86 |
| 11 | Phoenix, AZ | 4.193 | 4.762 | 4.858 | 2.02% | 10 | 1.31% | 11 |
| 12 | San Francisco, CA | 4.335 | 4.711 | 4.729 | 0.40% | 68 | -0.52% | 94 |
| 13 | Riverside-San Bernardino, CA | 4.225 | 4.570 | 4.622 | 1.14% | 34 | 0.45% | 37 |
| 14 | Detroit, MI | 4.296 | 4.322 | 4.326 | 0.11% | 82 | -0.34% | 79 |
| 15 | Seattle, WA | 3.440 | 3.884 | 3.939 | 1.41% | 27 | 0.20% | 46 |
| 16 | Minneapolis-St. Paul, MN-WI | 3.349 | 3.593 | 3.629 | 1.02% | 40 | 0.21% | 45 |
| 17 | San Diego, CA | 3.095 | 3.325 | 3.343 | 0.54% | 64 | -0.33% | 77 |
| 18 | Tampa-St. Petersburg, FL | 2.783 | 3.091 | 3.143 | 1.66% | 19 | 1.13% | 15 |
| 19 | Denver, CO | 2.543 | 2.893 | 2.932 | 1.36% | 29 | 0.59% | 30 |
| 20 | St. Louis,, MO-IL | 2.788 | 2.806 | 2.805 | -0.01% | 92 | -0.34% | 80 |
| 21 | Baltimore, MD | 2.710 | 2.799 | 2.803 | 0.15% | 80 | -0.33% | 78 |
| 22 | Orlando, FL | 2.134 | 2.513 | 2.573 | 2.39% | 5 | 0.68% | 27 |
| 23 | Charlotte, NC-SC | 2.217 | 2.525 | 2.569 | 1.76% | 17 | 1.03% | 17 |
| 24 | San Antonio, TX | 2.143 | 2.474 | 2.518 | 1.77% | 16 | 0.92% | 18 |
| 25 | Portland, OR-WA | 2.226 | 2.456 | 2.479 | 0.91% | 43 | 0.27% | 43 |
| 26 | Sacramento, CA | 2.149 | 2.320 | 2.345 | 1.07% | 38 | 0.45% | 36 |
| 27 | Pittsburgh, PA | 2.356 | 2.330 | 2.325 | -0.24% | 103 | -0.18% | 72 |
| 28 | Las Vegas, NV | 1.951 | 2.183 | 2.232 | 2.21% | 6 | 1.62% | 6 |
| 29 | Cincinnati, OH-KY-IN | 2.115 | 2.180 | 2.190 | 0.47% | 65 | 0.03% | 57 |
| 30 | Austin, TX | 1.716 | 2.115 | 2.168 | 2.51% | 4 | 1.39% | 8 |
| 31 | Kansas City, MO-KS | 2.009 | 2.127 | 2.144 | 0.77% | 55 | 0.24% | 44 |
| 32 | Columbus, OH | 1.902 | 2.082 | 2.107 | 1.16% | 33 | 0.32% | 42 |
| 33 | Cleveland, OH | 2.077 | 2.059 | 2.057 | -0.07% | 98 | -0.36% | 81 |
| 34 | Indianapolis. IN | 1.888 | 2.027 | 2.049 | 1.08% | 36 | 0.41% | 39 |
| 35 | San Jose, CA | 1.837 | 1.994 | 1.999 | 0.28% | 74 | -1.19% | 105 |
| 36 | Nashville, TN | 1.671 | 1.901 | 1.931 | 1.60% | 21 | 0.86% | 19 |
| 37 | Virginia Beach-Norfolk, VA-NC | 1.677 | 1.725 | 1.729 | 0.22% | 77 | -0.31% | 76 |
| 38 | Providence, RI-MA | 1.601 | 1.617 | 1.621 | 0.26% | 75 | -0.08% | 63 |
| 39 | Milwaukee,WI | 1.556 | 1.575 | 1.576 | 0.06% | 84 | -0.52% | 95 |
| 40 | Jacksonville, FL | 1.346 | 1.505 | 1.535 | 1.98% | 12 | 1.33% | 9 |
| 41 | Oklahoma City, OK | 1.253 | 1.383 | 1.396 | 0.95% | 41 | 0.35% | 41 |
| 42 | Raleigh, NC | 1.130 | 1.334 | 1.363 | 2.11% | 7 | 1.18% | 12 |
| 43 | Memphis, TN-MS-AR | 1.325 | 1.348 | 1.351 | 0.23% | 76 | -0.29% | 75 |
| 44 | Richmond, VA | 1.208 | 1.293 | 1.306 | 1.03% | 39 | 0.48% | 33 |
| 45 | Louisville, KY-IN | 1.236 | 1.293 | 1.297 | 0.35% | 71 | -0.08% | 62 |
| 46 | New Orleans. LA | 1.190 | 1.270 | 1.270 | -0.01% | 90 | -0.43% | 85 |
| 47 | Salt Lake City, UT | 1.088 | 1.205 | 1.223 | 1.44% | 26 | 0.01% | 58 |
| 48 | Hartford, CT | 1.212 | 1.207 | 1.206 | -0.03% | 95 | -0.60% | 96 |
| 49 | Birmingham, AL | 1.128 | 1.150 | 1.152 | 0.18% | 79 | -0.01% | 60 |
| 50 | Buffalo, NY | 1.136 | 1.130 | 1.130 | 0.04% | 86 | -0.17% | 71 |
| 51 | Rochester, NY | 1.080 | 1.072 | 1.071 | -0.05% | 96 | -0.39% | 82 |
| 52 | Grand Rapids, MI | 0.989 | 1.060 | 1.069 | 0.86% | 48 | 0.16% | 49 |
| 53 | Tucson, AZ | 0.980 | 1.028 | 1.039 | 1.13% | 35 | 0.78% | 22 |
| 54 | Fresno, CA | 0.930 | 0.987 | 0.994 | 0.80% | 53 | -0.10% | 64 |
| 55 | Tulsa, OK | 0.937 | 0.992 | 0.994 | 0.22% | 78 | -0.23% | 74 |
| 56 | Honolulu, HI | 0.953 | 0.986 | 0.980 | -0.64% | 106 | -1.32% | 106 |
| 57 | Worcester, MA-CT | 0.917 | 0.942 | 0.948 | 0.59% | 60 | -0.15% | 69 |
| 58 | Bridgeport-Stamford, CT | 0.917 | 0.943 | 0.944 | 0.04% | 87 | -0.76% | 99 |
| 59 | Omaha, NE-IA | 0.865 | 0.932 | 0.942 | 1.07% | 37 | 0.18% | 47 |
| 60 | Albuquerque, NM | 0.887 | 0.913 | 0.916 | 0.33% | 72 | 0.03% | 56 |
| 61 | Greenville, SC | 0.824 | 0.895 | 0.907 | 1.25% | 32 | 0.84% | 20 |
| 62 | Bakersfield, CA | 0.840 | 0.889 | 0.897 | 0.87% | 46 | -0.04% | 61 |
| 63 | Knoxville, TN | 0.838 | 0.876 | 0.883 | 0.86% | 47 | 0.80% | 21 |
| 64 | Albany, NY | 0.871 | 0.882 | 0.883 | 0.12% | 81 | -0.13% | 66 |
| 65 | McAllen, TX | 0.775 | 0.858 | 0.866 | 0.89% | 45 | -0.41% | 84 |
| 66 | New Haven CT | 0.862 | 0.858 | 0.858 | -0.02% | 93 | -0.60% | 97 |
| 67 | Oxnard, CA | 0.823 | 0.851 | 0.851 | 0.02% | 88 | -0.47% | 91 |
| 68 | El Paso, TX | 0.804 | 0.845 | 0.846 | 0.05% | 85 | -0.96% | 103 |
| 69 | Allentown, PA-NJ | 0.821 | 0.838 | 0.843 | 0.58% | 62 | 0.08% | 52 |
| 70 | Columbia, SC | 0.768 | 0.825 | 0.833 | 0.92% | 42 | 0.49% | 32 |
| 71 | Baton Rouge, LA | 0.802 | 0.831 | 0.831 | 0.02% | 89 | -0.47% | 90 |
| 72 | Sarasota, FL | 0.702 | 0.805 | 0.822 | 2.04% | 9 | 2.15% | 3 |
| 73 | Dayton, OH | 0.799 | 0.804 | 0.807 | 0.35% | 70 | 0.07% | 53 |
| 74 | Charleston, SC | 0.665 | 0.775 | 0.788 | 1.62% | 20 | 1.14% | 14 |
| 75 | Greensboro, NC | 0.724 | 0.763 | 0.768 | 0.55% | 63 | 0.11% | 50 |
| 76 | Cape Coral, FL | 0.619 | 0.740 | 0.755 | 2.04% | 8 | 1.64% | 5 |
| 77 | Stockton, CA | 0.685 | 0.743 | 0.753 | 1.37% | 28 | 0.60% | 29 |
| 78 | Little Rock, AR | 0.700 | 0.738 | 0.741 | 0.42% | 67 | 0.00% | 59 |
| 79 | Colorado Springs, CO | 0.646 | 0.725 | 0.739 | 1.86% | 13 | 1.14% | 13 |
| 80 | Boise, ID | 0.617 | 0.710 | 0.730 | 2.87% | 2 | 2.23% | 2 |
| 81 | Lakeland, FL | 0.602 | 0.686 | 0.708 | 3.23% | 1 | 2.44% | 1 |
| 82 | Akron, OH | 0.703 | 0.704 | 0.705 | 0.07% | 83 | -0.15% | 68 |
| 83 | Ogden, UT | 0.597 | 0.665 | 0.675 | 1.58% | 23 | 0.46% | 35 |
| 84 | Winston-Salem, NC | 0.641 | 0.667 | 0.671 | 0.71% | 56 | 0.48% | 34 |
| 85 | Madison, WI | 0.605 | 0.655 | 0.660 | 0.89% | 44 | 0.17% | 48 |
| 86 | Daytona Beach, FL | 0.590 | 0.648 | 0.660 | 1.77% | 15 | 1.84% | 4 |
| 87 | Des Moines, IA | 0.570 | 0.645 | 0.655 | 1.60% | 22 | 0.72% | 24 |
| 88 | Syracuse, NY | 0.663 | 0.651 | 0.651 | -0.08% | 99 | -0.46% | 87 |
| 89 | Wichita, KS | 0.631 | 0.645 | 0.645 | -0.01% | 91 | -0.47% | 88 |
| 90 | Provo, UT | 0.527 | 0.618 | 0.634 | 2.59% | 3 | 0.78% | 23 |
| 91 | Springfield, MA | 0.622 | 0.630 | 0.632 | 0.36% | 69 | -0.47% | 89 |
| 92 | Augusta, GA-SC | 0.565 | 0.600 | 0.604 | 0.69% | 57 | 0.36% | 40 |
| 93 | Toledo, OH | 0.610 | 0.604 | 0.603 | -0.16% | 101 | -0.47% | 92 |
| 94 | Melbourne, FL | 0.543 | 0.588 | 0.597 | 1.46% | 25 | 1.52% | 7 |
| 95 | Jackson, MS | 0.567 | 0.582 | 0.580 | -0.24% | 104 | -0.62% | 98 |
| 96 | Durham, NC | 0.504 | 0.566 | 0.575 | 1.57% | 24 | 0.72% | 25 |
| 97 | Harrisburg, PA | 0.549 | 0.571 | 0.575 | 0.62% | 59 | 0.10% | 51 |
| 98 | Spokane, WA | 0.528 | 0.564 | 0.573 | 1.69% | 18 | 1.31% | 10 |
| 99 | Chattanooga, TN-GA | 0.528 | 0.556 | 0.561 | 0.85% | 49 | 0.71% | 26 |
| 100 | Scranton, PA | 0.564 | 0.556 | 0.555 | -0.03% | 94 | -0.14% | 67 |
| 101 | Modesto, CA | 0.514 | 0.545 | 0.550 | 0.83% | 50 | 0.07% | 54 |
| 102 | Fayetteville, AR-MO | 0.463 | 0.538 | 0.549 | 1.99% | 11 | 1.07% | 16 |
| 103 | Lancaster, PA | 0.519 | 0.541 | 0.544 | 0.46% | 66 | -0.17% | 70 |
| 104 | Youngstown, OH-PA | 0.566 | 0.542 | 0.539 | -0.54% | 105 | -0.40% | 83 |
| 105 | Portland, ME | 0.514 | 0.532 | 0.535 | 0.59% | 61 | 0.54% | 31 |
| 106 | Lexington, KY | 0.472 | 0.513 | 0.517 | 0.77% | 54 | 0.05% | 55 |
| Derived from US Census Bureau Population Estimates | ||||||||
Wendell Cox is principal of Demographia, an international public policy and demographics firm. He is a Senior Fellow of the Center for Opportunity Urbanism (US), Senior Fellow for Housing Affordability and Municipal Policy for the Frontier Centre for Public Policy (Canada), and a member of the Board of Advisors of the Center for Demographics and Policy at Chapman University (California). He is co-author of the "Demographia International Housing Affordability Survey" and author of "Demographia World Urban Areas" and "War on the Dream: How Anti-Sprawl Policy Threatens the Quality of Life." He was appointed by Mayor Tom Bradley to three terms on the Los Angeles County Transportation Commission, where he served with the leading city and county leadership as the only non-elected member. Speaker of the House of Representatives appointed him to the Amtrak Reform Council. He served as a visiting professor at the Conservatoire National des Arts et Metiers, a national university in Paris.
Photo: Los Angeles: losing population (by author)


