
China is now the largest automobile market in the world. In 2018, 23.7 million new light vehicles were sold in China, compared to the 17.3 million sold in the United States. During the Great Recession, China displaced the US, which had been the world’s leading car market since the invention of the automobile.
In 2000, there were under 4 million light vehicles (including autos, SUVs, vans and personal trucks) in China. The National Bureau of Statistics reports that there were 207 million light vehicles in China, a more than 50 times increase.
By 2013, China had built more freeway length (highways without grade crossings) than the United States. By 2017, China had 85,000 miles (137,000 kilometers) of freeways, 25 percent more than the 68,000 miles (110,000 kilometers). China is about the same size as the United States geographically, although its population is heavily concentrated in its eastern third, including the eastern coast.
Vehicles in China: More Miles than in the United States
The National Bureau of Statistics, however, does not report total travel by light vehicles or for passengers in light vehicles. But, at least one academic source provides information. A report by Huan Liu at Beijing's Tsinghua University and 10 colleagues (Note 1) provides 2015 average annual vehicle kilometer estimates by light duty vehicle, for China and by provincial level jurisdiction for 2015.
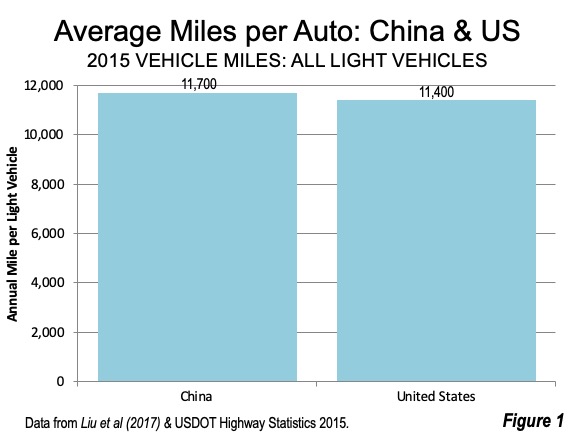
The results are surprising. Given China’s much more compact cities, shorter travel distances and intense traffic congestion in the larger cities, one might expect that the average light vehicle in China would travel considerably fewer miles than its counterpart in the United States. Not so.
In 2015. Liu et al, estimate that light vehicles averaged 18,900 kilometers (11,700 miles). This is slightly more than the average US light vehicle, which, according to the US Department of Transportation, traveled 18,400 kilometers (11,400 miles). Liu et al developed their average vehicle kilometer estimates from GIS data (Figure 1).
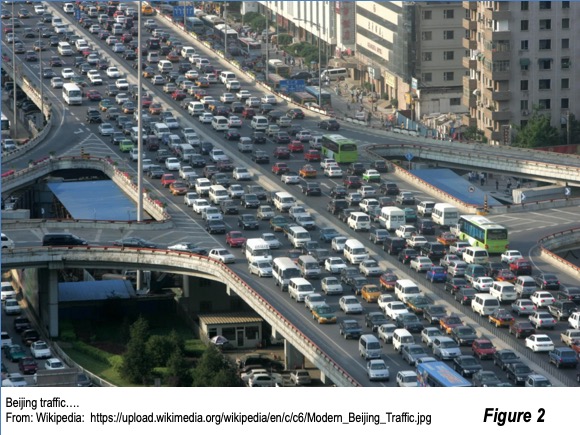
The Liu et al provincial level data indicates substantial variations. Not surprisingly, Beijing, with its intractable congestion (Figure 2) and building its seventh ring road, had the lowest light vehicle use, at 8,200 miles (13,200 kilometers). But light vehicles traveled the longest distance less dense and uncongested Gansu, at 15,900 miles (25,500 miles). Gansu has some of the most wide-open spaces in China, much of it over the mountains from the capital Lanzhou, in the Gobi Desert (Top photograph).
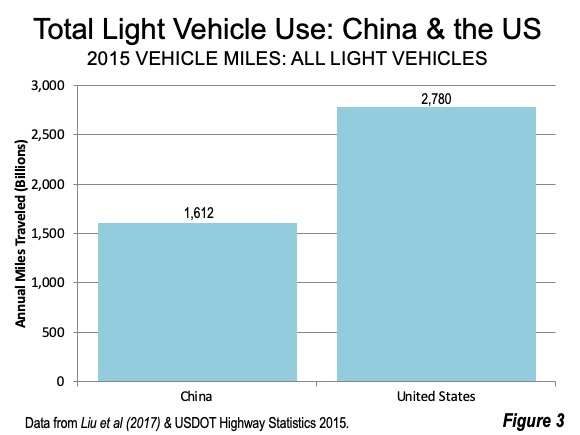
From the Liu, et al data, it is possible to calculate an estimate of the total light vehicle travel in China for 2015, which is 42 percent less than in the United States (Figure 3).
It is likely that there has been material convergence in this figure since 2015. Between 2015 and 2017 the national data sources indicate an addition of a net 45 million vehicles in China, while only 8 million net were added in the United States. In 2018, China added more than another 20 million (2018 data not yet available for the US). China’s extraordinary growth rates are to be expected, because there are many more “first car” buyers. China has 0.4 light vehicles per household now, compared to nearly 2.0 in the United States.
Passenger Travel by Car
The Liu et al data appears to provide a reliable estimate of vehicle use. However, vehicle-occupancy data is not readily available for China. The only estimate we found was for Shanghai, at 1.7 passengers per vehicle. (see: Zhan Zhou and Jinhua Zhou, Has Shanghai's Transportation Demand Passed its Peak Growth?). Given Shanghai’s high number of vehicles per capita (second only to Beijing) and its high income (also second only to Beijing), it seems likely that there is more single occupant driving than in the rest of the nation. This suggests that, if anything, the 1.7 figure would be conservative for China. By comparison, the recent US Nationwide Household Transportation Survey found average vehicle occupancy to be a similar 1.67.
Using the 1.7 Shanghai vehicle occupancy rate for the nation, it can be estimated that China’s passenger cars traveled 2.7 trillion (4.4 trillion passenger kilometers) passenger miles in 2015. This compares to the US total of 4.7 trillion passenger miles (7.5 trillion passenger kilometers) in 2015.
Provisional Overall Travel Market Shares
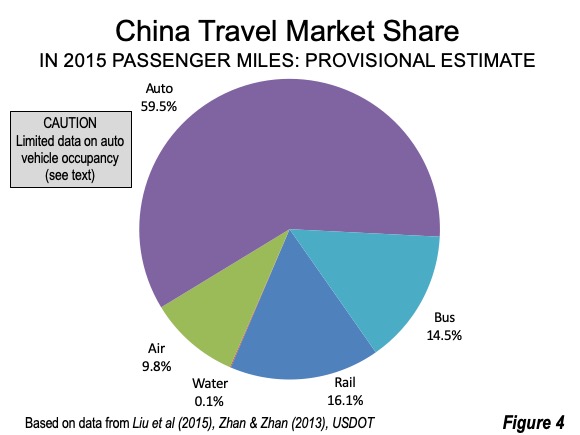
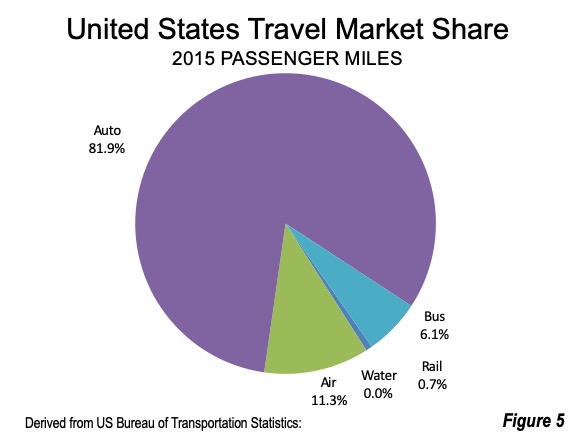
Using this estimate, China’s passenger vehicle share of person travel in 2015 is provisionally estimated at 59.5 percent. Rail is second, at 16.1 percent, buses third at 14.5 percent and air at 9.8 percent (Figure 4). This compares to 81.9 percent for passenger vehicles in the United States, Air accounts for the second largest market share, at 11.5 percent, buses 6.1 percent and rail 0.7 percent (Figure 5).
Airlines also provide a surprising amount of travel in China.By 2015, China’s air passenger miles had reached 70 percent of the US figure. Later data (2017) indicates that China now has 85 percent as much air travel in the United States. If that rate continues China could be have the most traveled domestic airline sector in the world by 2020.
Other Comparisons: China had already passed the 28 nation European Union in air travel.Meanwhile, in the last five years, China has passed India to become the world’s leading passenger rail system.In addition, with two-thirds of the world’s high speed rail services, China carried 3.4 times as many passenger kilometers as by all high speed rail systems in the 28 nations of the European Union.
Different Cultures, Similar Results
There are substantial and obvious cultural differences between China and the United States. Yet, as regards personal mobility, there are remarkable similarities. Light vehicle ownership is rising rapidly in China and has become the most important source of mobility in the nation. China’s cars, SUVs, vans and personal trucks travel virtually the same distance as those in the United States. Cultures differ, but human preferences seem to remain the same, once prosperity approaches high-income world levels.
Note1: Authors include Liu, H., Man, H., Cui, H., Wang, Y., Deng, F., Wang, Y., Yang, X., Xiao, Q., Zhang, Q., Ding, Y., and He, K.: “An updated emission inventory of vehicular VOCs and IVOCs in China,” Atmos. Chem. Phys., 17, 12709–12724.
Note 2: The estimates began with the vehicle kilometer estimates develop by Liu et al by provincial level jurisdictions. Provincial level totals were estimated using 2015 passenger vehicle numbers from the China Yearbook: 2015. The only vehicle occupancy data identified was for Shanghai, a provincial level city. That figure 1.70, was assumed for all provincial level jurisdictions and the nation. These estimates should be considered provisional, especially due to the uncertainty of the vehicle occupancy assumption
Photograph: G-30 Expressway (background) in western Gansu’s Hexi Corridor, by author.
Wendell Cox is principal of Demographia, an international public policy and demographics firm. He is a Senior Fellow of the Center for Opportunity Urbanism (US), Senior Fellow for Housing Affordability and Municipal Policy for the Frontier Centre for Public Policy (Canada), and a member of the Board of Advisors of the Center for Demographics and Policy at Chapman University (California). He is co-author of the "Demographia International Housing Affordability Survey" and author of "Demographia World Urban Areas" and "War on the Dream: How Anti-Sprawl Policy Threatens the Quality of Life." He was appointed by Mayor Tom Bradley to three terms on the Los Angeles County Transportation Commission, where he served with the leading city and county leadership as the only non-elected member. Speaker of the House of Representatives appointed him to the Amtrak Reform Council. He served as a visiting professor at the Conservatoire National des Arts et Metiers, a national university in Paris.


