
This article expands on the 2000 to 2019 state net domestic migration data from last week, covering the 110 metropolitan areas with more than 500,000 residents (Note). The big surprise may be that the largest proportional outflow of net domestic migrants, outside Hurricane Katrina ravaged New Orleans was San Jose, the nation’s most affluent metropolitan area and perhaps the wealthiest in the world. In both cases, many more people left in the first 10 years than since 2010. The San Jose migration loss since 2010 was one-half that of 2000-2010, however New Orleans gained back about five percent of its previous loss.
Top Domestic Migration Population Gainers
Seven of the metros with the largest actual number of net domestic migrants were in the South, while three were in the West (Figure 1). Phoenix added 940,000 net domestic migrants over the period. This is equal to nearly one-fifth of the population, which was nearing 5,000,000 according to the 2019 estimate. By comparison, this is more than 12 times the 330,000 who inhabited the metropolitan area in 1950. Now Phoenix is the nation’s 10th largest metropolitan area, having passed Boston, San Francisco and Riverside-San Bernardino in the last decade.
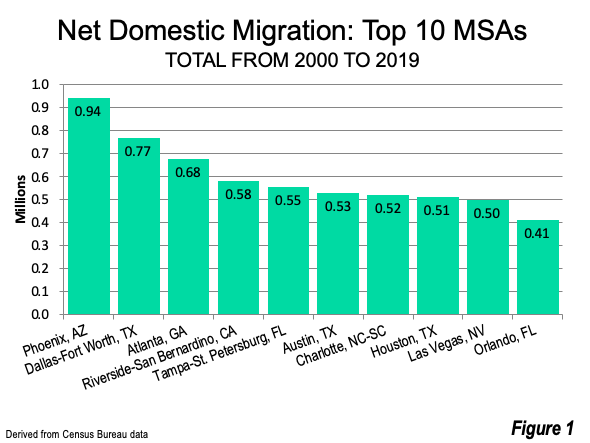
Dallas-Fort Worth added 770,000 net domestic migrants, second only to Phoenix. Dallas-Fort Worth is now the fourth largest metropolitan area in the United States. Atlanta, which has grown faster than any of the top ten metropolitan areas in the last 50 years, added 680,000 net domestic migrants in the last two decades.
Six metropolitan areas added between 500,000 and 600,000 net domestic migrants, including Riverside-San Bernardino, Tampa-St. Petersburg, Austin, Charlotte, Houston and Las Vegas. Orland added the 10th most, at 410,000.
All of the top gainers in terms of total numbers, not surprisingly, were among the 53 metropolitan areas with more than 1,000,000 population.
Top Proportional Gainers
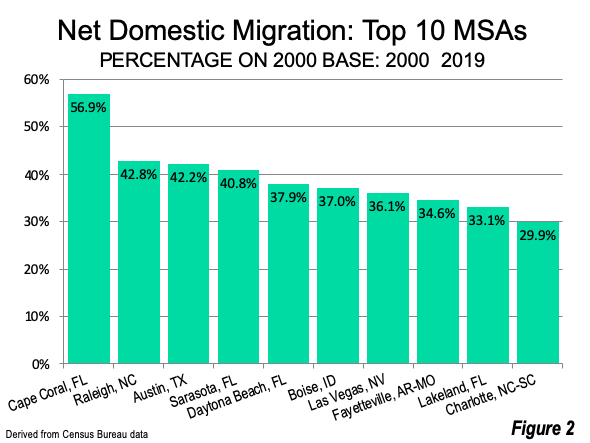
Six of the 10 metros gaining the largest percentage of net domestic migrants relative to their 2000s populations have between 500,000 and 1,000,000 population. Four of the top proportional gainers were in Florida.
Retiree attracting Cape Coral, Florida gained the most, at 56.9% of its 2000 population (Figure 2). Raleigh gained the second largest percentage, at 42.8%, followed closely by Austin, at 42.2% and Sarasota, at 40.8%. Daytona Beach, Boise, Las Vegas, Fayetteville (Arkansas) and Lakeland (FL). Lakeland is located just east of Tampa-St. Petersburg and just west of Orlando, which placed 5th and 10th in total net domestic migration gains. Charlotte placed 10th in its proportional gain, at 29.9%.
Largest Net Domestic Migration Losses
New York, the largest metropolitan area, suffered by far the largest net domestic migration loss over the last two decades (Figure 3). More than a net 3.4 million New Yorkers moved away. This is more people than live in 20 states, the largest of which is Utah (3.3 million). It is more people than live in all but 16 metropolitan areas, the largest of which is San Diego.
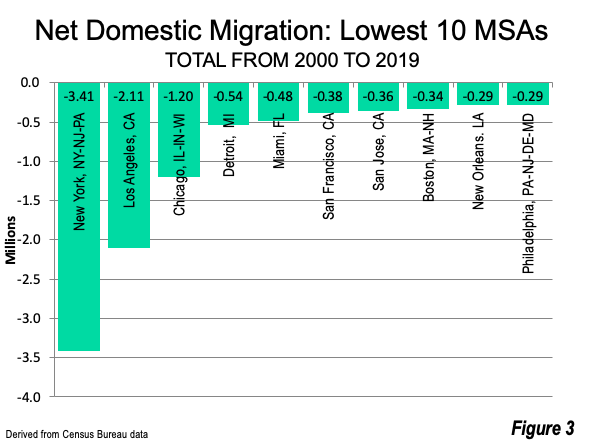
Los Angeles, the second largest metropolitan area had the second largest net domestic migration loss, at 2.1 million. Third ranked Chicago sustained the third largest net domestic migration loss, at 1.2 million. Detroit lost more than 500,000 net domestic migrants, while Miami lost nearly as many. San Francisco, San Jose, Boston, New Orleans and Philadelphia each lost between 290,000 and 400,000 net domestic migrants.
Largest Proportional Losses
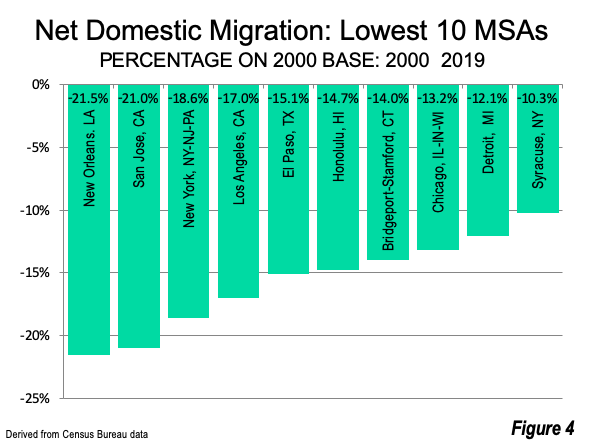
New Orleans, devastated by Hurricane Katrina in the middle 2000s, suffered the largest proportional net domestic migration loss relative to its 2000 population, at 21.5% (Figure 4). San Jose nearly equaled New Orleans, with a net domestic migration loss of 21% since 2000. New York lost 18.6% of its population to net domestic migration, while Los Angeles lost 17.0%. El Paso, Honolulu, Bridgeport-Stamford, Chicago, Detroit and Syracuse more people moved out at rates from 10.3% to 15.1%.
Prospects
The prospects could be even more negative for the metropolitan areas with the denser urban cores --- especially New York, where the exodus from New York City has been estimated to be as much as the entire population gain from 1950 (as a result of the COVID-19 virus). People are going out of their way to avoid the overcrowding that is endemic to higher urban residential and employment densities. Yet not all of the COVID related migration will involve inter-metropolitan moves. In the metropolitan areas with transit legacy cities, there could be substantial moves from the dense urban cores to more spacious suburban and exurban environments, where there is considerably less overcrowding, as well as larger houses for living and working along with yards for the kids.
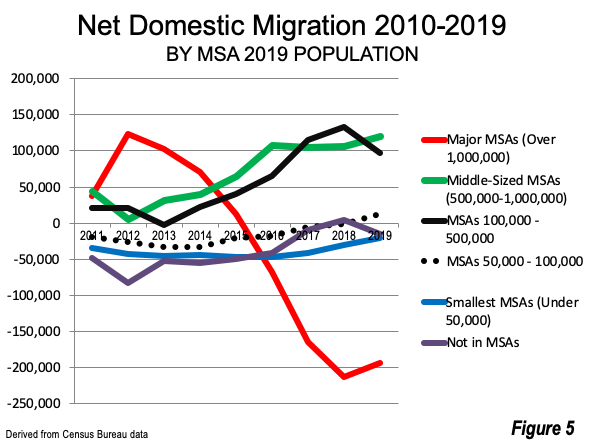
Even so, the strongly developing trend, even before COVID-19 was of migration away from the larger metropolitan areas --- those over one million residents, to smaller areas, especially to the 57 with populations between 500,000 and 1,000,000 and the 275 with populations from 100,000 to 500,000 (Figure 5). Households have plenty of options for 21st century lifestyles
The new world of “Zoom” meetings, along with the threat of illness (or worse) and economic loss from lockdowns could conceivably result in demographic shifts to rival the acceleration of suburban growth following World War II. It could change significantly the role of core municipalities --- large and small --- and accelerate the dispersion that has been the primary trend for the last half century.
Note 1: The Census Bureau estimates net domestic migration trends, which are released with the annual population estimates. In both the 2000s and 2010s, data is provided from April (the decennial census date) of the “00” year through June of the “09” year (the end of the annual “estimate year”). As a result, no data is available for January through March 2000, July 2009 through March 2010 and June 2019 through December 2019.
Note 2: The new Office of Management and Budget metropolitan area delineations (used in this article) have added a second “Fayetteville” to the list of those over 500,000. The new, larger Fayetteville, North Carolina is rated as the 108th largest metropolitan area, with 527,000 residents in 2019. Fayetteville, Arkansas (longer name: Fayetteville-Springdale-Rogers), previously shown with more than 500,000, is ranked just above Fayetteville, NC, at 107th, with a population of 535,000. The Arkansas metropolitan areas, however, is growing about twice as fast as the one in North Carolina, so some distance in ranking between the two is likely to result in the years to com.
Wendell Cox is principal of Demographia, an international public policy firm located in the St. Louis metropolitan area. He is a founding senior fellow at the Urban Reform Institute, Houston and a member of the Advisory Board of the Center for Demographics and Policy at Chapman University in Orange, California. He has served as a visiting professor at the Conservatoire National des Arts et Metiers in Paris. His principal interests are economics, poverty alleviation, demographics, urban policy and transport. He is co-author of the annual Demographia International Housing Affordability Survey and author of Demographia World Urban Areas.
Mayor Tom Bradley appointed him to three terms on the Los Angeles County Transportation Commission (1977-1985) and Speaker of the House Newt Gingrich appointed him to the Amtrak Reform Council, to complete the unexpired term of New Jersey Governor Christine Todd Whitman (1999-2002). He is author of War on the Dream: How Anti-Sprawl Policy Threatens the Quality of Life and Toward More Prosperous Cities: A Framing Essay on Urban Areas, Transport, Planning and the Dimensions of Sustainability.
Photograph: Phoenix, largest metropolitan area net domestic migration gain since 2000 (by author).


